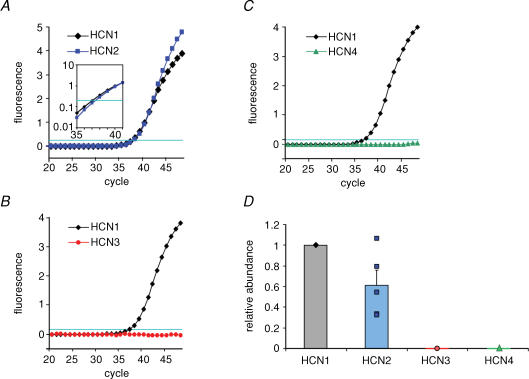
Figure 5. Single-cell RT-qPCR reveals that BCs coexpress HCN1 and HCN2 subunits.
A–C, detection of HCN subunits by RT-qPCR analysis. The mRNA of the material harvested from a single cell was reverse-transcribed, and the resulting cDNA was split into two aliquots to examine the coexpression of two HCN subunits in a given cell. Note that BCs coexpressed HCN1 and HCN2, but lacked detectable expression of HCN3 and HCN4. Inset in A is logarithmic plot of fluorescence between cycle 35 and 41, illustrating a difference in Ct value (i.e. cycle number in which fluorescence reaches an arbitrary threshold of 0.2; horizontal lines in A–C). D, relative abundance of HCN1–4 cDNA in single BCs. For each subunit, relative abundance was quantified as , where . Data from 11 BCs.

