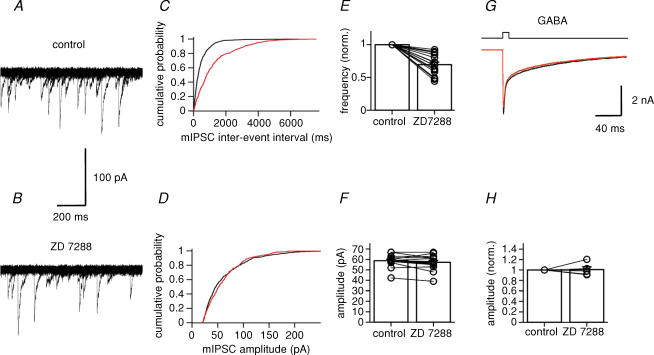
Figure 7. Ih channel block reduces the frequency of miniature IPSCs in granule cells.
A, 20 consecutive traces of spontaneous mIPSCs recorded in a granule cell at −70 mV under control conditions. B, similar traces after application of 30 μm ZD 7288. For display purposes, recorded traces were digitally filtered at 1 kHz. C, cumulative histograms of mIPSC interevent interval. D, cumulative histograms of mIPSC peak amplitude. Black curves, control; red curves, 30 μm ZD 7288. Data shown in A–D were obtained from the same cell. E and F, summary bar graphs showing the effects of ZD 7288 on mIPSC frequency (normalized to control values, E) and amplitude (F). Left bar, control; right bar, 30 μm ZD 7288. Data from 15 granule cells. Bars represent mean values, circles represent data from individual experiments. In all experiments, 1 μm TTX, 10 μm CNQX and 20 μm d-AP5 were added to the bath solution. G, currents activated by fast application of 1 mm GABA (10-ms pulse) to a nucleated patch isolated from a granule cell. Holding potential, −50 mV. Black trace, control (pulse from Na+-rich solution to Na+-rich solution + 1 mm GABA); red trace, 30 μm ZD 7288 (pulse from Na+-rich solution + 30 μm ZD 7288 to Na+-rich solution + 30 μm ZD 7288 + 1 mm GABA). Each trace is the average of 20 single sweeps. H, summary bar graph showing the lack of effects of ZD 7288 on GABA-activated currents (n = 5 patches).

