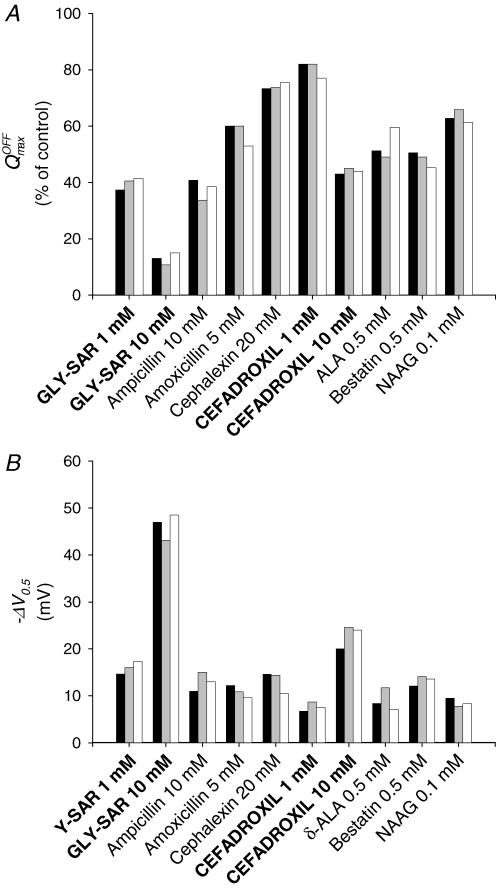
Figure 8. Effect of substrates on hPEPT1 charge distribution.
A, reduction in Qmax by Gly-Sar and selected drugs in representative oocytes expressing WT (black bar), S117N (grey bar) and G419A (white bar) hPEPT1. B, shift of V0.5 in the same oocytes. Data are from the same oocytes shown in Figs 6 and 7. The apparent maximum charge (Qmax) and the voltage for 50% charge movement (V0.5) in a Na+ buffer at pH 5.0 were determined from the Q–V relations and the Boltzmann equation (see Methods).

