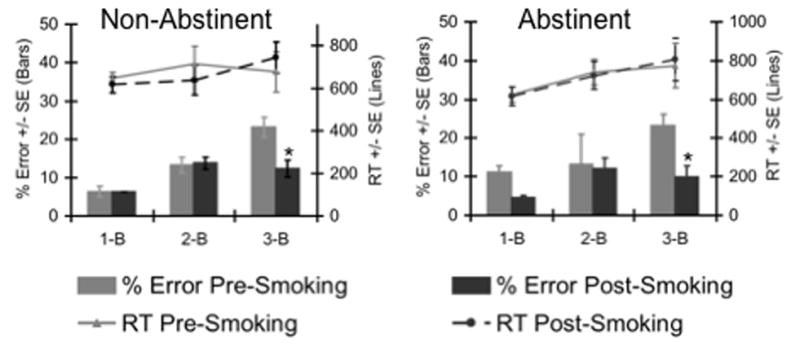
Fig. 1.

N-Back performance of smokers in sessions following either smoking ad libitum or smoking abstinence (> 13 h). Lines indicate mean RT’s and bars indicate mean percent of errors, both at each N-Back level. Left panel, session following smoking ad libitum, right panel, session following smoking abstinence. In both sessions, subjects showed significantly fewer errors at the 3-back level after acute smoking.
