
Fig. 3.
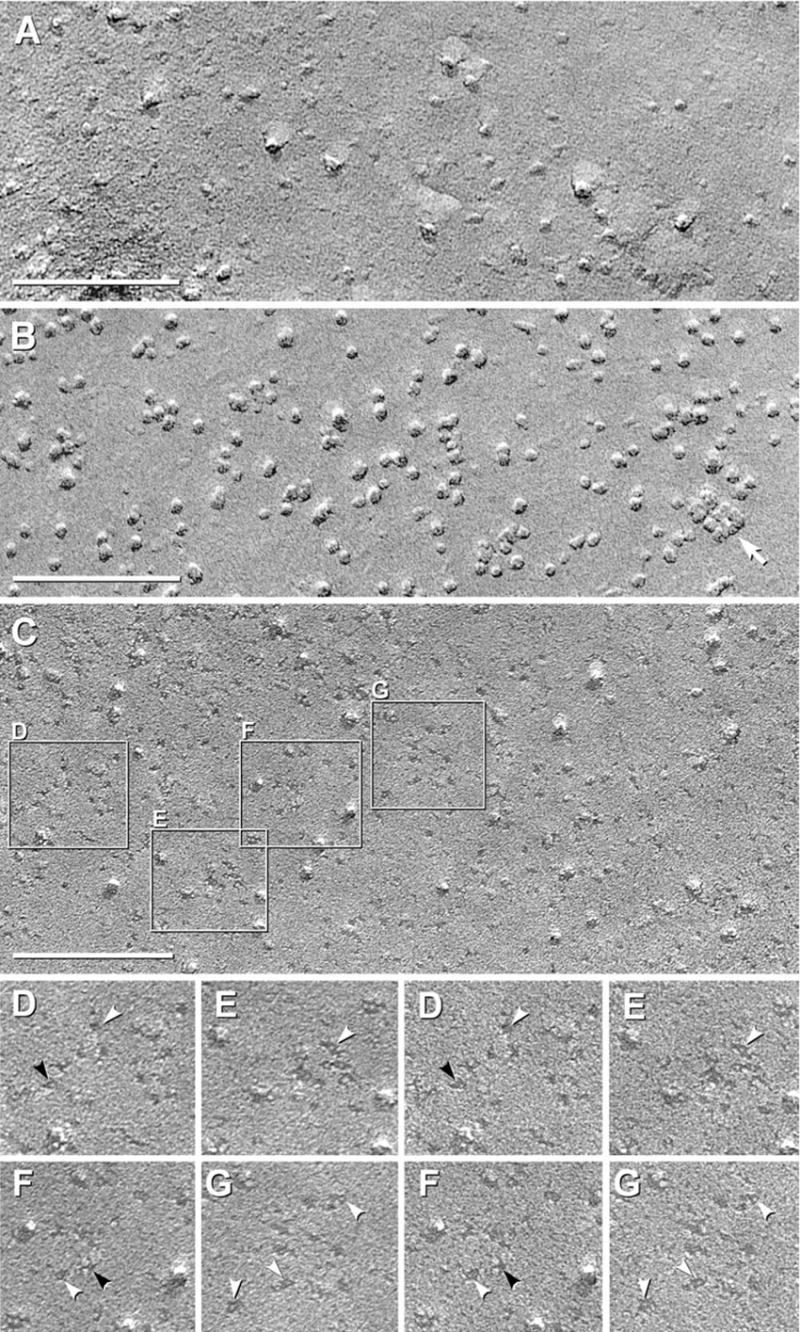
Black shadow images of E-face of control CHO cells (A) and P- and E-face images of CHO cells expressing M1 variant of AQP4 (B–G). (A) E-face image of control CHO cell has “baseline” number of large particles but very few 4.5 nm diameter pits. (B) P-face image of M1 expressing cell has abundant 4–6 nm diameter IMPs, and in this area, only one square array (arrow). (C) E-face of CHO cell expressing M1. A large increase in 4.5–5 nm pits is observed above “control” value. Selected areas are shown stereoscopically at higher magnification (D–G). (D–G) Pegs are seen in most pits (white arrowheads). Many pits exhibit 1×2 nm “furrows,” frequently oriented at right angles (D, F; black arrowheads).