
Fig. 4.
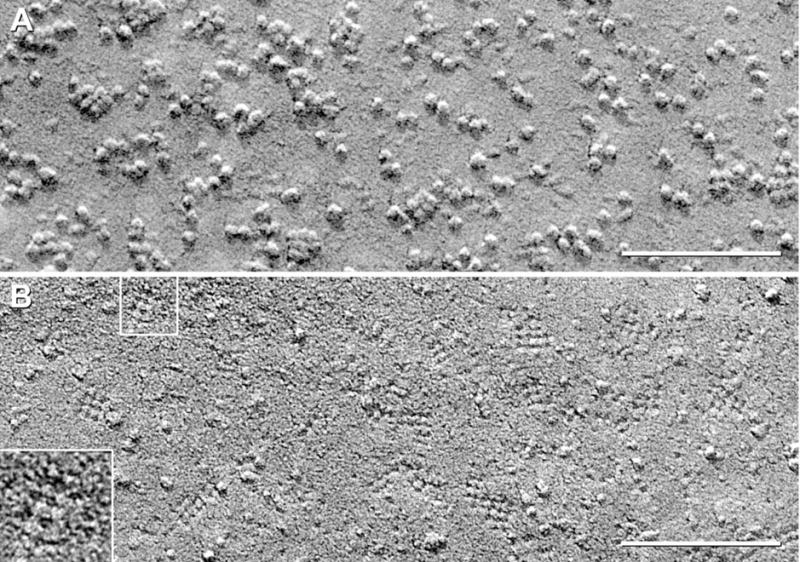
P- and E-face views of CHO cells co-expressing M1+M23. (A) P-face images reveal abundant but small square arrays. (B) E-face images of square array imprints. Pegs are visible in almost all pits. Many pits are linked by furrows, but up to 50% of furrows are missing. Inset shows array of seven pits linked by about four cross-bridges, but excessive granularity of this replica prevented more detailed analysis.