
Fig. 8.
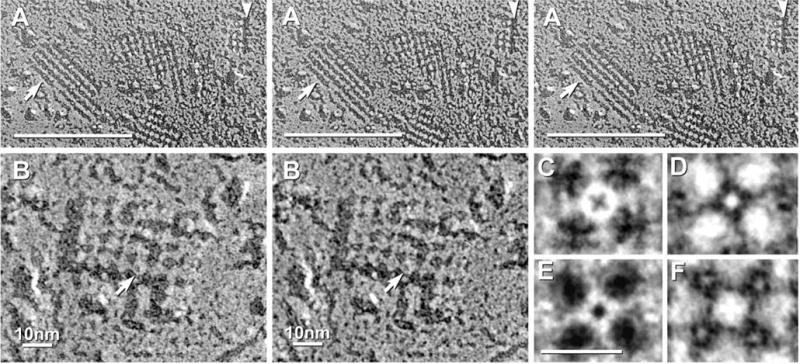
(A) Stereoscopic (left pair) and reverse stereoscopic images (right pair) of square arrays in E-face showing that the “nodes” are fractured at a lower level than the surrounding membrane E-face. In “intaglio” images (right pair), this relative elevation is reversed so that the “nodes” artificially appear as raised “waffles.” (B) High-magnification stereoscopic image of one AQP4 square array. Several IMPs have central depressions or “dimples” (arrow). (C) Rotational reinforcement image of the IMP indicated in “B.” The central depression appears as an “X.” (D, E) Rotational reinforcement images of E-face pits printed with black shadows (D) and white shadows (E). In the black-shadow image (D), the peg (bright spot) is smaller than the dimple in the adjacent P-face IMP (C). In the white shadow image (E), the (now white) pit appears almost identical to the IMP in the black shadow image (C). Four nodes around the central peg (D, E) are approximately the same diameter as P-face IMPs, indicating that both nodes and IMPs each occupy approximately 50% of the cross-sectional area within a square array. (F) Rotational reinforcement of “node” showing reinforcement of four surrounding “pegs” (bright spots within darker E-face pits).