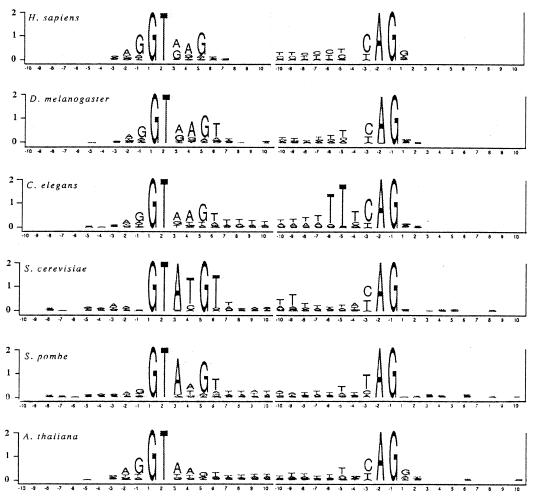
Figure 2.
Information content at each position in the 10 bases flanking the exon intron boundary and the intron–exon boundary. The total height at each position is given by the information content at that position. The height of each letter is proportional to the fraction that base is of the total at each position.

