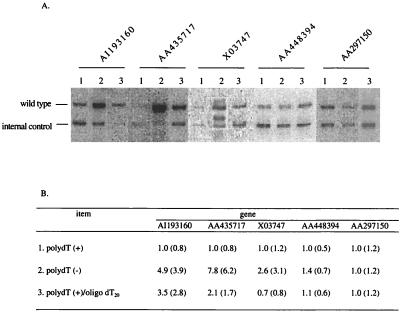
Figure 5.
Increased level of low-abundance copies with poly(dA/dT)− cDNAs. (A) Quantitative PCR showing the signals in different samples. Lanes: 1, poly(dA)+ tester and poly(dA/dT)+ driver; 2, poly(dA)− tester and poly(dA/dT)− driver; 3, poly(dA)+ tester, poly(dA/dT)+ driver plus oligo(dT)20 blocking primer. (B) Comparison of relative levels. The numbers within parentheses are the original ratio between wild-type and control amplicons. The number from the reaction of the poly(dA)+ tester and poly(dA/dT)+ driver (line 1) was set at 1.0. Numbers from other samples were normalized to this value.

