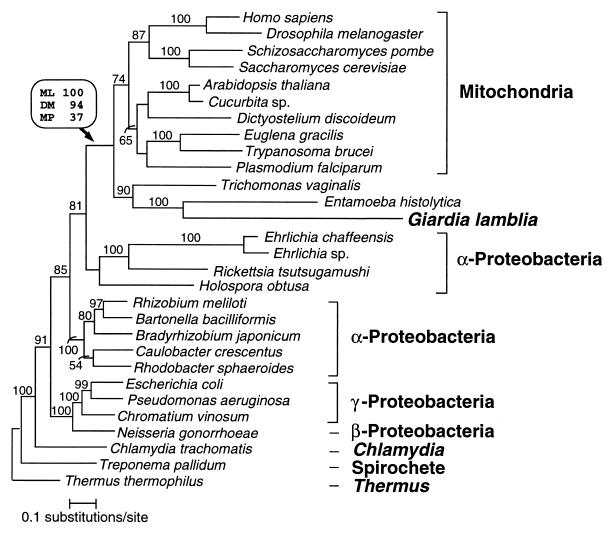
Figure 4.
Phylogenetic relationships of cpn60 homologs. Protein maximum likelihood analysis of 513 aligned amino acid positions yielded the tree shown (log likelihood = −18676.09). Optimal trees obtained by using protein distance and maximum parsimony methods differed from this topology in the branching order of the major eukaryotic groups and, to a lesser extent, within the α-, β-, and γ-proteobacterial clades. The branching order between these clades was identical for all methods. Bootstrap values obtained for the G. lamblia/mitochondrial-like cpn60 clade when using protein maximum likelihood (ML), protein distance matrix (DM), and maximum parsimony (MP) methods are shown in a box above the relevant node (indicated by an arrow). For all other nodes in the tree, protein ML bootstrap values (where >50%) are shown above each branch. The scale bar indicates estimated sequence divergence per unit branch length.

