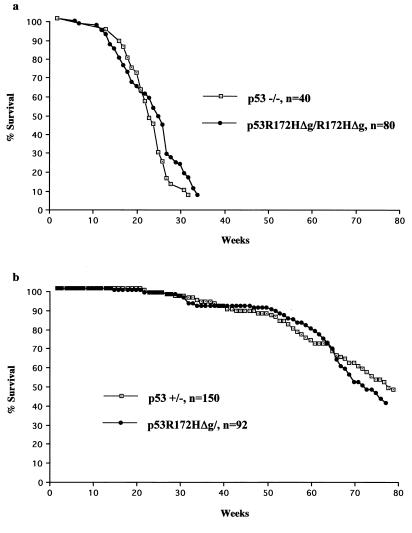
Figure 3.
Comparisons of survival between p53 null mice and p53R172HΔg mice. The p53−/− mice survival data set is from our lab, and the p53+/− mice survival data set is from Harvey et al. (17). (a) Survival curves of 80 p53R172HΔg/R172HΔg mice and 40 p53−/− mice. (b) Survival curves of 92 p53R172HΔg/+ mice and 150 p53+/− mice.

