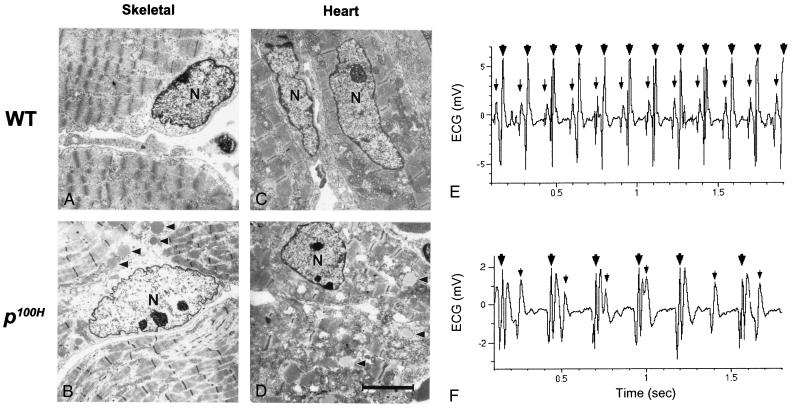
Figure 4.
Electron micrographs of skeletal and cardiac muscle cells (A–D) and ECG of wild-type (E) and the mutant (F). WT, the wild-type littermate (A and C), p100H, the p100H homozygote (B and D). N, nucleus. Arrow heads in B and D indicate deposits found in the mutant muscle cells. The scale bar in D is equal to 4 μm. Representative ECG of the wild type (E) and the mutant (F) are shown. The small arrow indicates P-wave, activation of the atria, and the large arrow indicates QRS-complex, activation of the ventricles. The ECG of F shows the third degree (complete) heart block observed in a postnatal day-12 p100H mouse less than 24 h before death.

