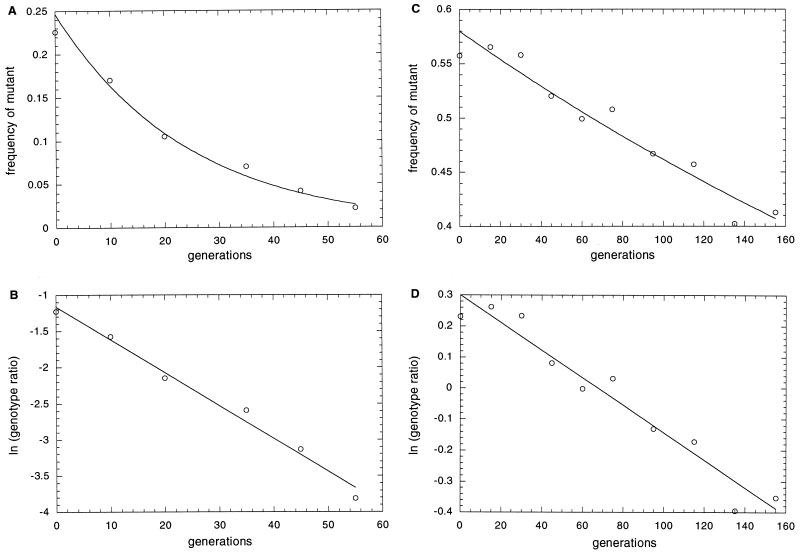
Figure 1.
Representative competition experiments. (A and C) The decline in frequency of the disruption mutants TD64 and TD63, respectively, as a function of generations in culture. Note the different scales. (B and D) The natural log of the ratio of the disruption strain to the wild-type strain for the same data, each with a line that is the least-squares fit with a slope that provides an estimate of the selection coefficient (s) reported in Table 1.

