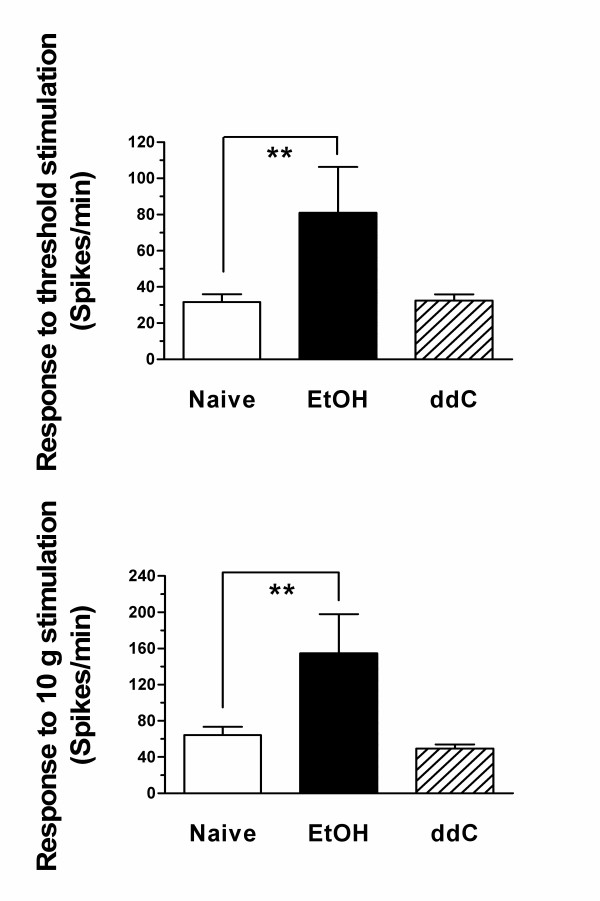
Figure 3.
The mean responses to both sustained (60 sec) threshold and 10 g stimuli of ddC, EtOH and control C-fibers were significantly different (one way ANOVA, p < 0.01). The responses of EtOH group (n = 15) were significantly higher than those of control rats (n = 38, p < 0.01, Tukey's multiple comparison test) while the responses of C-fibers in the ddC group (n = 18) were similar to those of controls (p > 0.05, Tukey's multiple comparison test).

