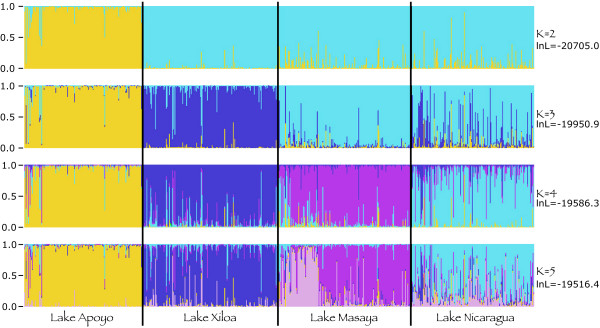
Figure 2.

Results of the analysis for genetic clustering using STRUCTURE. The lakes from which each individual was collected are indicated below the graph. Colors correspond to the different genetic clusters estimated by the analysis (colors are the same as in Fig. 1), each individual has a probability of being assigned to a given cluster that is proportional to the height of that colored bar, the more uniform the color of the bar, the more probable it is that that individual is entirely composed of genetic material composed of the given structure. The log likelihood of each assumed number of populations (k = 2 to 5) is shown.
