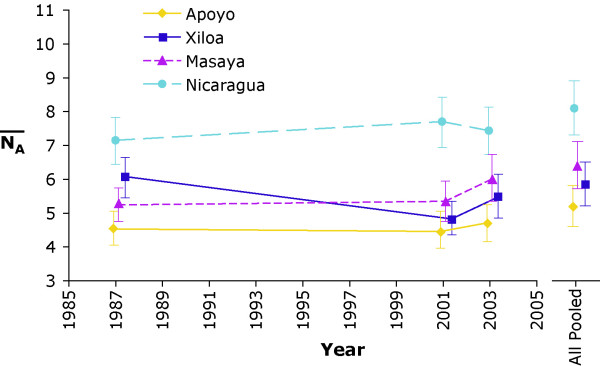
Figure 4.

Average microsatellite allelic richness through time. Error bars are 95% confidence intervals from the 10,000 bootstrap replicate samples. Also shown are the average allelic diversities for each lake when all genotypes, regardless of sampling year, are pooled. Lake Nicaragua has significantly (p < 0.05) more allelic richness than any of the crater lakes. Only Lake Xiloa has a significant change in allelic richness through time, wherein the 2001 sample is less than 1987.
