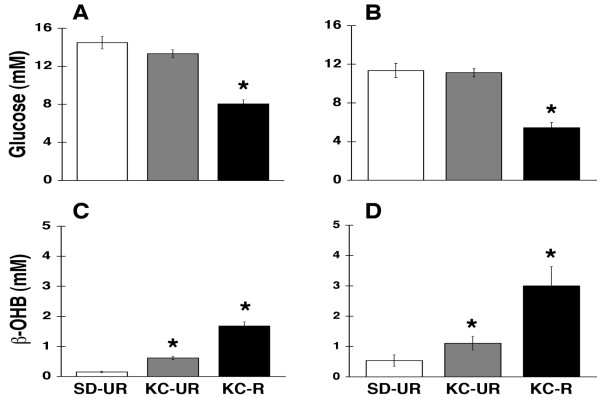
Figure 4.
Influence of diet on plasma glucose and β-OHB levels in B6 mice bearing the CT-2A astrocytoma (A and C), or in SCID mice bearing the human U87 glioma (B and D). Values are expressed as mean ± SEM (n = 12–14 mice per group) and the asterisks indicate that the values differ from the control SD-UR group at the at the P < 0.01 level.

