
Figure 2.
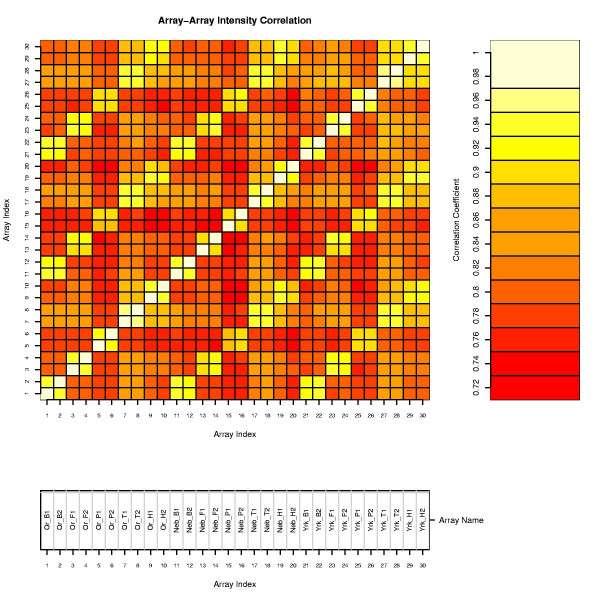
Heat Map Plot of Array-array Correlation Coefficients. The Spearman correlation coefficient was computed to quantify the degree of similarity between each pair of arrays. For the array name, "Or, Neb and Yrk" stands for three laboratories from the centers of Oregon, Nebraska and Yerkes, respectively while "B, F, P, T, H" represent the tissues of Cortex, Fibroblast, Pancreas, Testis and Thymus, respectively. "1 and 2" are the two replicated measurements for each RNA extract.