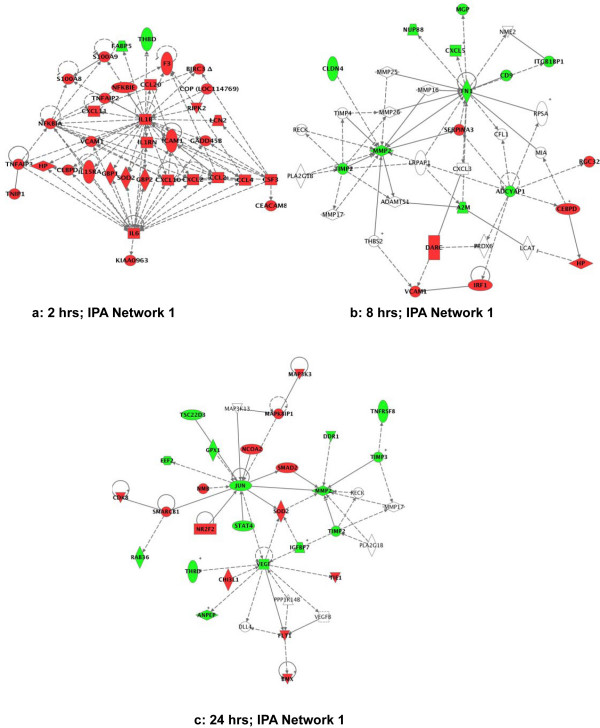
Figure 3.

Ingenuity Pathway Analysis (IPA) of the differentially expressed genes at different time points after E. coli challenge. Green indicates down-regulation and red indicates up-regulation. In this map all genes shown were statistically different from the control. A line indicates that two gene products show binding, a line terminated by arrow indicate that one gene product acts on the other gene product, and the plus sign indicate that other networks contain the gene product. The networks with the highest score in each time-point group are illustrated. a: IPA network 1 at 2 hrs; b: IPA network 1 at 8 hrs; c: IPA network 1 at 24 hrs. See the Additional files 2, 3, 4 for lists of genes involved in each network.
