
Figure 7.
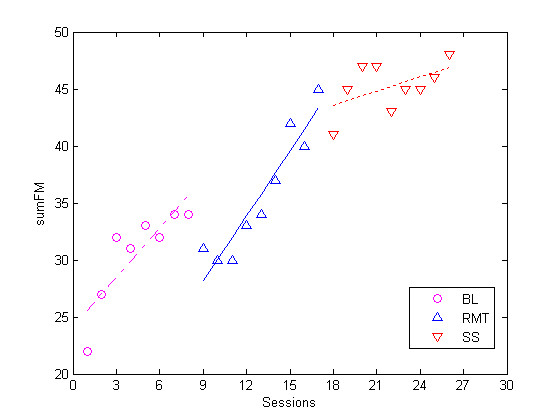
Comparison between slopes of the regression line for different phases of the trial, one typical subject. The sumFM scores from each phase is accompanied by a regression line calculated using the least square method.
Official websites use .gov
A
.gov website belongs to an official
government organization in the United States.
Secure .gov websites use HTTPS
A lock (
) or https:// means you've safely
connected to the .gov website. Share sensitive
information only on official, secure websites.
Comparison between slopes of the regression line for different phases of the trial, one typical subject. The sumFM scores from each phase is accompanied by a regression line calculated using the least square method.