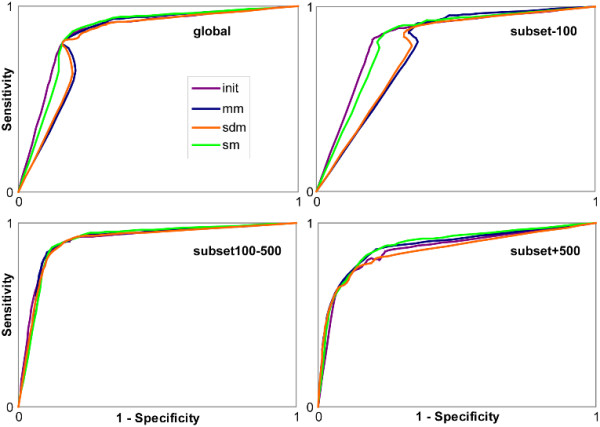
Figure 5.

ROC curves. Based on the 192 common good quality MACS, ROC curves were constructed for the global protein set, subset-100, subset100–500 and subset+500 based on the residue conservation analysis. ROC curves are coloured according to the sampling method: in violet no sampling method, in blue mm, in orange sdm and in green sm.
