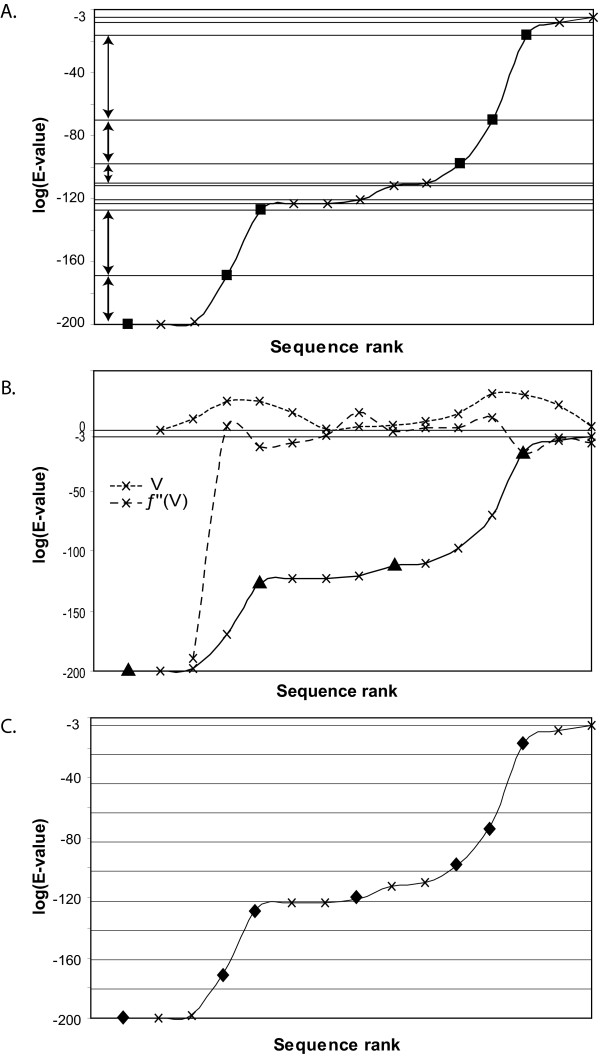
Figure 7.
Sequence selection according to the sampling method algorithms. Sequences detected by BlastP searches are represented according to the logarithm of their E-value on the graphs (×) and sequences selected by each method are represented by ■ for mm, ▲ for sdm and ◆ for sm. (a) mm selection: differences between the logarithms of 2 successive E-values greater than the computed threshold are represented by a bidirectional arrow; (b) sdm selection: V is the computed E-value variation function. Sequences corresponding to V inflexion points are selected; (c) sm selection: the logarithmic curve of the BlastP E-values is cut in x strips (x = 10 on the graph) of equal width. Inside each non empty strip, the sequence associated to the smallest E-value is selected. mm, sdm and sm systematically select the first sequence detected by BlastP search.

