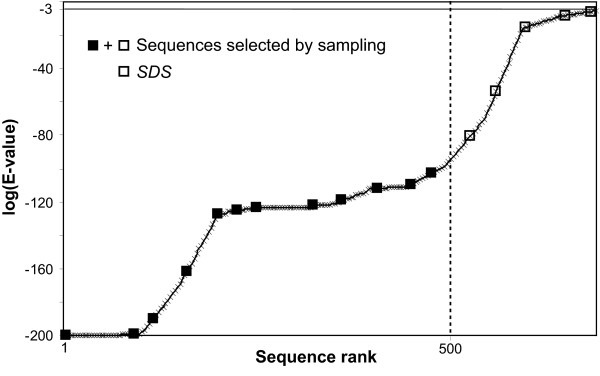
Figure 8.
Sampled distant sequences. The graph represents sequences collected by BlastP searches according to the logarithm of their E-values. Sequences selected by sampling are marked with a square. When more then 500 sequences are highlighted, the first 500 sequences are aligned in MACS_init. Sampled Distant Sequences (SDS) indicate sequences with an E-value > 0.001 and ranking after the 500 first sequences in BlastP results, selected by any sampling method.

