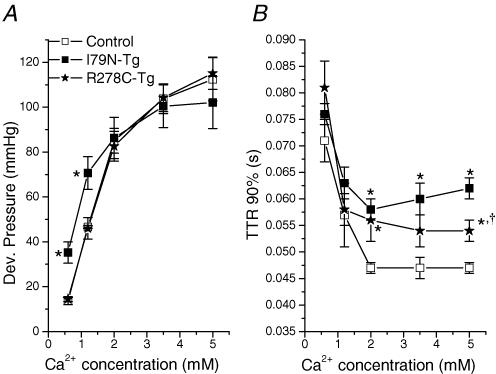
Figure 3. Ca2+ dependence of maximum developed pressure (A) and time to 90% relaxation (B) of control, R278C-Tg and I79N-Tg hearts.
For each heart, time to 90% relaxation was determined at balloon volumes that produced maximum developed pressure, and average values plotted for control (n = 6), R278C-Tg (n = 6) and I79N-Tg (n = 4) hearts. *P < 0.05 versus control; †P < 0.05 I79N-Tg versus R278C-Tg.

