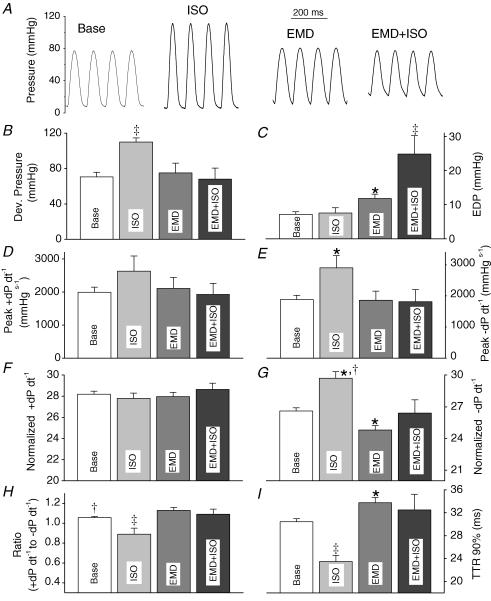
Figure 6. Effect of the myofilament Ca2+ sensitizer EMD 57033 on cardiac contractile function at a fast pacing rate (10 Hz).
A, representative pressure tracings recorded from hearts at baseline, in presence of isoproterenol (ISO, 0.1 μmol l−1), in presence of EMD 57033 (3 μmol l−1), and in presence of ISO and EMD. Comparison of average maximum developed pressure (B), end-diastolic pressure (EDP, C), peak +dP dt−1 (D), peak −dP dt−1 (E), normalized peak +dP dt−1 (F), normalized peak −dP dt−1 (G), ratio of peak −dP dt−1 over peak +dP dt−1 (H), and time to 90% relaxation (I). Data are means ±s.e.m.; *P < 0.05 versus baseline; †P < 0.0.5 versus EMD, ‡P < versus all other.

