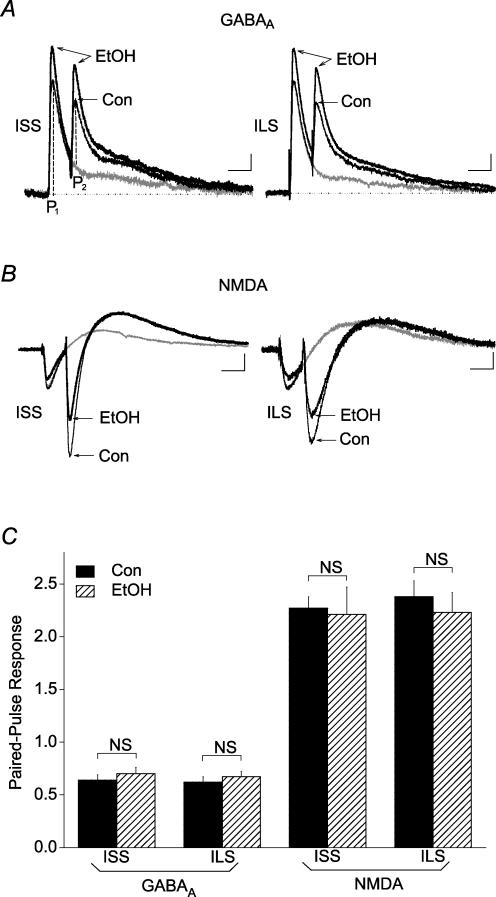
Figure 7. Ethanol did not significantly alter the PPR recorded with potassium gluconate-filled electrodes at GABAergic or glutamatergic terminals from ISS or ILS mice.
Representative paired-pulse responses from proximal GABAA IPSCs (A) and NMDA EPSCs (B) from ISS and ILS mice before and during application of 120 mm ethanol. The PPR was calculated as the ratio of the peak amplitude (P2) generated by a second stimulus pulse, subtracting for any overlapping component due to the first response, divided by the amplitude of the response (P1) generated from the first pulse, as shown in A. C, summary data shows that although ethanol (120 mm) had significant effects on GABAA IPSCs and NMDA EPSCs from both ISS and ILS mice, as indicated by changes in P1, this concentration of ethanol did not significantly alter PPR values for GABAA IPSCs or NMDA EPSCs from either ISS or ILS mice. Number of cells in these experiments: ISS, GABAA, n = 6; ISS, NMDA, n = 7; ILS, GABAA, n = 7; ILS, NMDA, n = 6. Scales for A: ISS, 50 ms, 15 pA; ILS, 50 ms, 20 pA. Scales for B: ISS, 50 ms, 25 pA; ILS, 50 ms, 15 pA.

