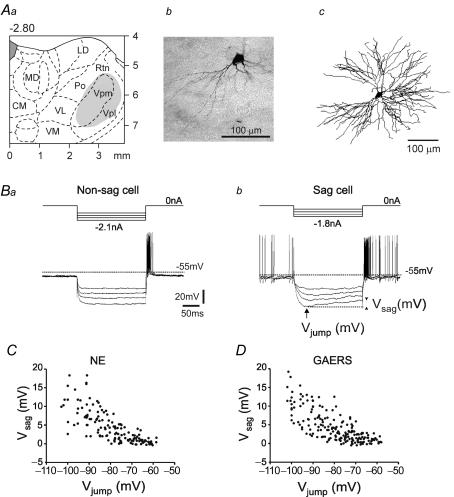
Figure 1. Hyperpolarization-induced depolarizing sags in thalamocortical (TC) neurones in vivo.
Aa, stereotaxic location (2.8 ± 0.2 mm posterior to bregma) of the intracellularly recorded TC neurones (grey area). Ab and c, photomicrograph and 3D reconstruction of a typical TC neurone intracellularly labelled with Neurobiotin in the Vpm nucleus (frontal section). Ba and b, four voltage responses to 200 ms hyperpolarizing current pulses of increasing intensity in a neurone without (left, ‘non-sag cell’) and with (right, ‘sag cell’) a sag. The sag amplitude (Vsag) was measured as indicated in Bb (arrowheads). C and D, plot of Vsag amplitudes versus Vjump values in TC neurones of GAERS (C; n = 28 cells with at least 5 values per cell) and of control non-epileptic (NE) rats (D; n = 22 cells with at least 5 values per cell). CM = central medial; LD = lateral dorsal; MD = medial dorsal; Po = posterior thalamic nuclear group; VL = ventral lateral; VM = ventral medial; Vpl = ventral posterolateral; Vpm = ventral posteromedial; Rtn = nucleus reticularis thalami.

