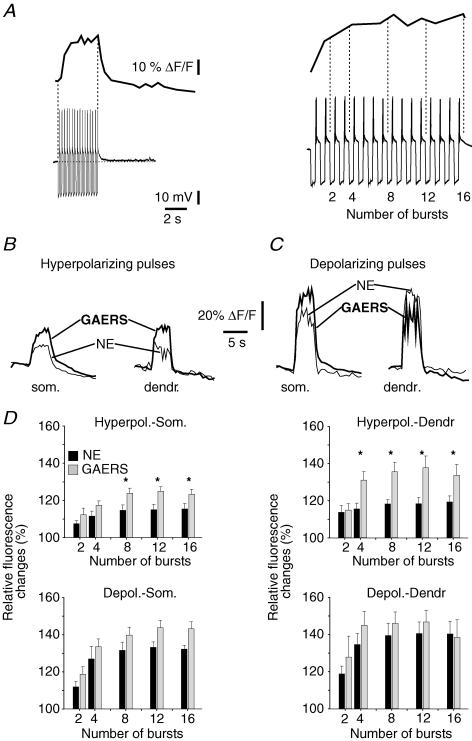
Figure 7. Repetitive hyperpolarizing current pulses evoke greater intracellular Ca2+ increases in GAERS neurones.
A, left, representative sweeps showing the relative fluorescence changes evoked after repetitive rebound Ca2+ bursting in a cell from a NE rat. Right, expanded portion of the trace illustrating the time sections (vertical dotted lines) within which Ca2+ signals were averaged and compared. B, Ca2+ transients recorded in somatic (som.) and dendritic (dendr.) regions after somatic injection of hyperpolarizing currents to induce rebound bursting. Transients are averages of 5 successive sweeps for cells from a NE animal (thin line) and a GAERS (thick line). C, as in B, but depolarizing current pulses were injected. D, top, pooled data showing the relative changes in fluorescence evoked after repetitive hyperpolarizing pulses and recorded from somatic (Hyperpol.-Som., n = 8 for both NE and GAERS) or dendritic (Hyperpol.-Dendr., n = 6 for NE, n = 5 for GAERS) regions. Bottom, as top but for depolarizing somatic pulses recorded in soma (Depol.-Som., n = 5 for NE, n = 6 for GAERS) or in dendrites (Depol.-Dendr., n = 4 for both NE and GAERS). *P < 0.05.

