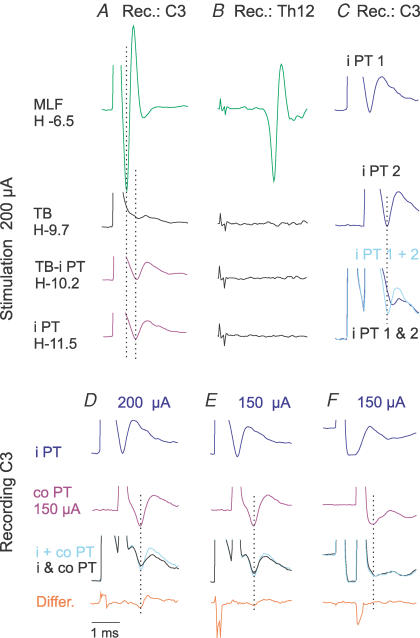
Figure 2. Estimation of current spread from the ipsilateral PT stimulation site.
A and B, descending volleys evoked by stimulation at the indicated depths along an electrode track, above and within the ipsilateral PT (i PT). The depths are in the Horsley-Clarke horizontal coordinates. The volleys were recorded from the cord dorsum at the third cervical (C3) segment and from the left lateral funiculus at the 12th thoracic (Th12) segment. Note that stimuli applied within and up to 1.8 mm above the final position of the electrode in the PT (in the trapezoid body, TB) failed to evoke short latency volleys that are induced from the MLF (upper traces, H-6.5 mm), both in records from the Th12 and from the C3 where the positive peaks of MLF and PT volleys are indicated by two dotted lines. C–F, examples of paired-pulse tests used to define the critical stimulus intensity at which stimuli applied in the i PT might coexcite fibres in the contralateral pyramidal tract (co PT), as indicated by smaller C3 volleys following co PT stimuli applied ≤ 0.8 ms after i PT stimuli (due to their refractoriness). As shown in C, the volley evoked by two 200 μA stimuli applied in the same PT 0.6 ms apart (bottom records; i PT 1 & 2) was much smaller than the sum of volleys (top and middle records) evoked by same stimuli (i PT 1 + 2) when they were applied separately. Records in D show that 200 μA stimuli showed some spread of current from the i PT to co PT, but the spread of current became negligible when the intensity of PT stimuli was reduced to 150 μA because only marginal difference was then seen between volleys evoked by separate (i + co PT) and joint (i & co PT) stimulation of the two PTs in some experiments (E) and no differences were detected in other experiments (F). In all these tests co PT was stimulated at the same intensity of 150 μA. In all panels, averages of 20 single records are shown, with the negativity upwards.

