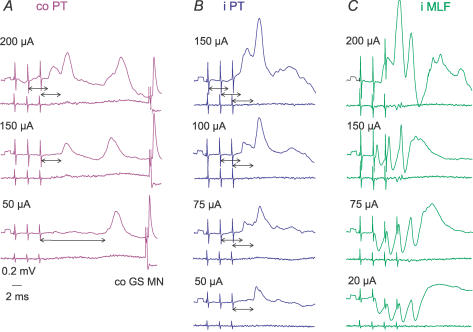
Figure 4. Examples of postsynaptic potentials evoked by PT and MLF stimuli of different intensities.
Intracellular records from a commissural interneurone (upper traces) and records from the cord dorsum (lower traces); averages of 20 successive records. A and B, EPSPs evoked by stimulation of the co PT and i PT at decreasing stimulus intensities. Double-headed arrows indicate the latencies of these potentials with respect to the effective stimuli, following the procedure illustrated in Fig. 3. Note that when the intensity of PT stimuli was decreased, the third but not the second 150 μA stimulus in A, and 50 μA in B, evoked early EPSPs, and that the 50 μA stimulus in A evoked only late EPSPs. C, similar series of records of EPSPs and EPSP/IPSP sequences evoked by stimulation of the MLF. Note that the weakest MLF stimuli evoked only IPSPs in this interneurone. Blocked antidromic spike potentials evoked from the contralateral GS motor nucleus (co GS MN; at threshold of 9 μA) are shown only in A.

