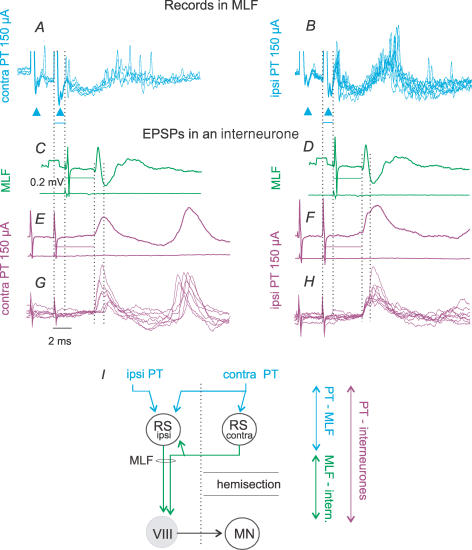
Figure 6. Time relationship between EPSPs of PT and MLF origin and responses of RS neurones to PT stimuli.
A and B, single sweep records from the MLF. Only records with discharges following either the first or the second stimulus have been superimposed. C–F, averages (n = 20) of PSPs from commissural interneurones (upper traces) and cord dorsum potentials aligned so that the onsets of the EPSPs evoked from the MLF and PT, indicated by the third dotted lines, coincided. Note that the difference between the stimuli is very similar to the latency of MLF responses to PT stimuli. G and H, superimposed single sweep records of the largest EPSPs used for these averages. Records are from the same interneurone as in Fig. 4. The time intervals between the first two dotted lines in C–F indicate differences in latencies of EPSPs evoked from the MLF and PT. The same lines in A and B indicate a delay in discharges recorded in MLF with respect to PT stimuli. Arrowheads in A and B indicate triphasic presynaptic volleys induced by PT stimuli. I, interconnections between RS neurones which would allow excitation of RS neurones (e.g. that to the left of the midline) by axon collaterals of other RS neurones (e.g. that to the right) and explain additional synaptic delays in actions of PT neurones on RS neurones. Double-headed arrows indicate sums of synaptic delays and conduction times as indicated. Voltage calibration of 0.2 mV in C and time calibration of 2 ms in G are for all records.

