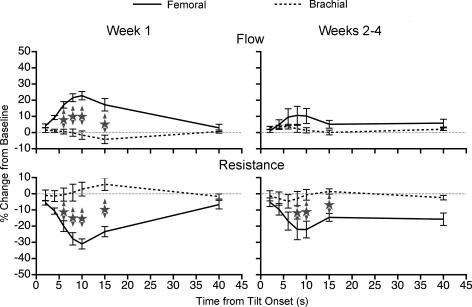
Figure 7. Comparison of the effects of removal of vestibular inputs on forelimb and hindlimb blood flow and vascular resistance during 60 deg head-up rotation performed in a darkened laboratory.
The percentage changes in femoral and brachial blood flow or vascular resistance from the pre-tilt baseline are illustrated on the same graph; data collected after the removal of vestibular inputs are plotted relative to those before vestibular lesion. The left-hand panel shows differences between responses recorded during the first week after vestibular lesion and those determined prior to lesion; the right-hand panel illustrates data recorded subsequent to the first week after removal of vestibular inputs relative to pre-lesion responses. Stars show significant differences in mean femoral and brachial blood flow or resistance values at the same time point. Error bars indicate one s.e.m.

