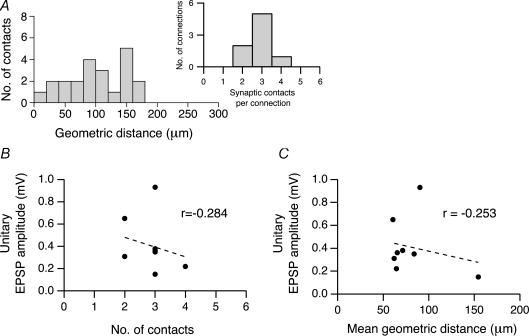
Figure 6. Number and location of synaptic contacts on dendrites.
A, histogram showing the geometric distances of light microscopically identified synaptic contacts from the soma in eight L2/3 pyramidal cell pairs (n = 22 contacts). Inset, distribution of the number of synaptic contacts per individual connection. B, relationship between the unitary EPSP amplitude in the postsynaptic L2/3 pyramidal cells and the number of synaptic contacts per connection. The correlation coefficient r obtained for B was −0.284. C, relationship between the unitary EPSP amplitude and the mean geometric distance from the soma of synaptic contacts in a connection. The correlation coefficient r was – 0.253. For both graphs, the correlation was statistically not significant.

