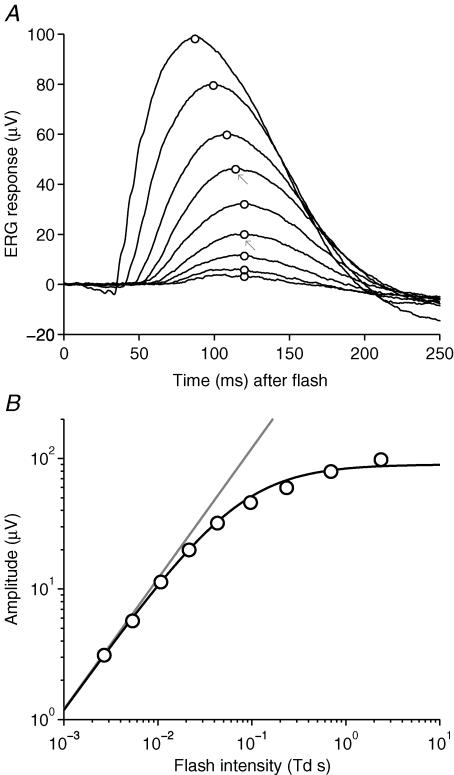
Figure 1. Scotopic b-wave responses to flashes of increasing intensity.
A, family of scotopic b-wave responses to dim blue flashes of nine intensities, delivered on a very dim blue background (0.015 Td), for representative subject A.M.C. Responses are averaged from three repetitions of the experiment conducted on separate days. Each trace is averaged from between 126 and 237 flash presentations, and on different days the amplitude scaling varied by less than 10%. The flash intensity differed slightly on the 3 days, due to small variations in the diameter of the dilated pupil; the averaged flash intensities were: 0.0027, 0.0054, 0.011, 0.022, 0.043, 0.097, 0.23, 0.69 and 2.4 Td s. Arrows indicate the two standard flash intensities used in subsequent experiments on light adaptation and dark adaptation. The interflash interval was 1 s for the seven dimmest flashes, and 2 s for the two brightest intensities. B, the average amplitudes of the b-wave responses, measured as indicated by the circles in A (see text), have been plotted against flash intensity. The continuous curve shows the Naka-Rushton hyperbolic saturation function, eqn (2), with rmax = 90 μV and Q0 = 0.075 Td s; the grey line shows its linear asymptote at low intensities.

