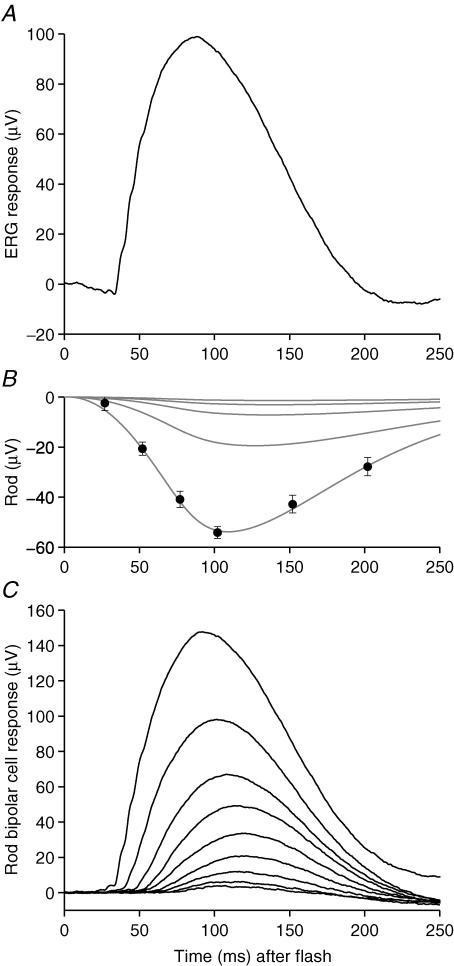
Figure 3. Estimation of underlying rod photoreceptor activity using the paired flash method and extraction of rod bipolar cell responses.
A, the continuous trace is the ERG recorded in response to a flash of 2.4 Td s from Fig. 1A; it is characterized by a prominent corneal-positive b-wave, preceded (at this intensity) by a small corneal-negative a-wave component. B, the symbols plot our estimates of the underlying rod photoreceptor contribution to this response, derived from paired-flash experiments. The test flash of Q = 2.4 Td s was followed by a probe flash of 7000 Td s, at one of six intervals, and the response was measured at a fixed time of 7 ms after the probe flash. Responses were averaged from 24 to 30 presentations at each separation, and an interval of at least 30 s was left between repetitions to allow full recovery. The symbols plot rod(t), the reduction in amplitude of response to the probe flash, compared with probe flash alone, as given in eqn (1) of Methods; for further details, see Friedburg et al. (2001). The paired-flash measurements were fitted with a theoretical expression to describe the time course of the rod photoreceptor response given as eqns (6) and (7a) in Friedburg et al. (2001), with activation parameters K = 8.6 photoisomerizations (Td s)−1, A = 5.2 s−2 photoisomerization−1, and td= 3 ms, and with inactivation parameters τrec= 70 ms, n = 8, and t0= 84 ms. Based on this description of the rod response to the 2.4 Td s flash, it was possible to extrapolate the predicted rod photoreceptor response to any dimmer flash by substituting the intensity Q. The curves in B plot predicted rod responses to the five brightest flash intensities used in Fig. 1A. C, family of deduced rod bipolar cell responses, obtained by subtraction of the estimated rod responses from the ERG traces in Fig. 1A; see Fig. 1 legend for flash intensities. Subject, A.M.C.

