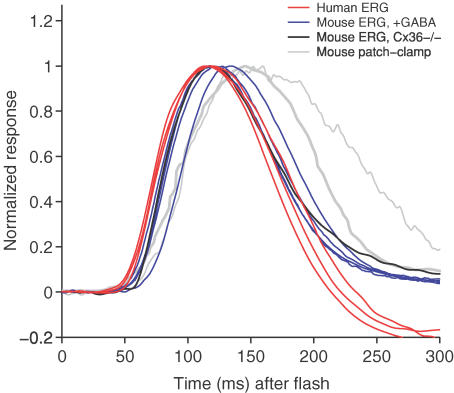
Figure 4. Comparison of rod bipolar cell responses estimated here, with those reported in the literature, for flashes of about 1 photoisomerization per rod.
The red traces plot the human scotopic b-wave response to flashes of about 0.12 Td s (range 0.1–0.14 Td s, or 0.9–1.2 R* rod−1), obtained in the present study for our three subjects; the traces (from left to right during the recovery phase) are for A.M.C., T.D.L. and O.A.R.M. The blue and black traces are published murine scotopic b-wave responses from Fig. 3 of Robson et al. (2004); data kindly provided by Dr J. G. Robson. Blue traces plot GABA-isolated scotopic b wave responses obtained from four wild-type mice (∼1–1.2 R* rod−1), while black trace plots the scotopic b-wave response from a connexin36 knockout mouse with optic nerve crush (∼1 R* rod−1). The grey traces plot whole-cell patch-clamp recordings of murine rod bipolar cell responses. The thick grey trace shows the response averaged from 10 cells (∼1 R* rod−1) as recorded by Field & Rieke (2002); data kindly provided by Dr F. Rieke. The thin grey trace shows a single response from one cell (∼0.9 R* rod−1) from Fig. 6A of Berntson et al. (2004); data kindly provided by Dr W. R. Taylor. All traces have been normalized to unit peak amplitude.

