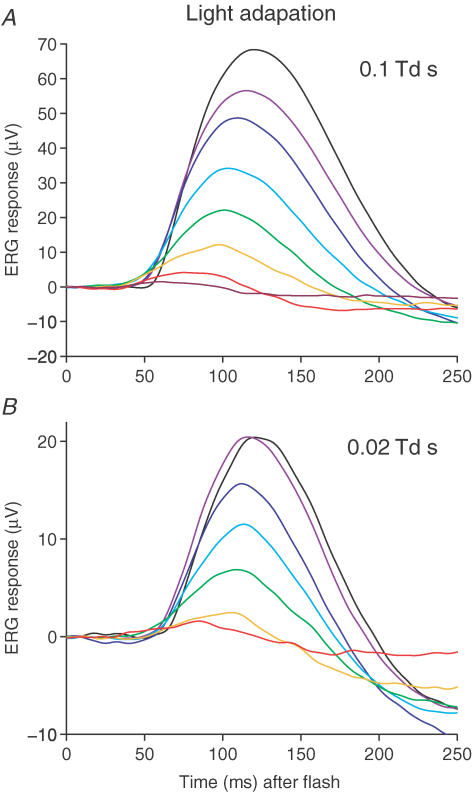
Figure 5. Light adaptation of scotopic b-wave flash responses.
Traces plot b-wave responses to test flashes of a fixed intensity under dark-adapted conditions (black traces), and in the presence of backgrounds of increasing intensity (coloured traces), for subject A.M.C. A, test flash intensity 0.1 Td s; background intensities 0, 0.014, 0.041, 0.14, 0.41, 1.4, 4.1 and 14 Td. B, test flash intensity 0.02 Td s; background intensities 0, 0.016, 0.048, 0.16, 0.48, 1.6 and 4.8 Td.

