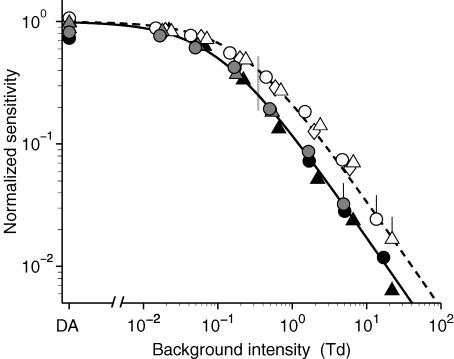
Figure 6. Weber's Law desensitization of the scotopic b-wave response amplitude.
Symbols plot the normalized sensitivity of the scotopic b-wave response, measured using either the conventional ‘criterion amplitude’ approach (black symbols), or with flashes of fixed intensity (0.1 Td s, open symbols; 0.02 Td s, grey symbols). Each subject's measurements are plotted with the same symbol: A.M.C. (circles); T.D.L. (triangles); O.A.R.M. (diamonds). Curves plot Weber's Law, eqn (2) with exponent n = 0.88 and with half-desensitizing intensity: I0= 0.1 Td (continuous curve), and I0= 0.22 Td (dashed curve). Measurements for each subject were averaged over several experiments. Prior to pooling, the results from each experiment were individually fitted with eqn (2), and normalized vertically before averaging. Numbers of experiments averaged were as follows. For criterion amplitude of ∼10 μV: •, A.M.C., one experiment; ▴, T.D.L., one experiment. For 0.1 Td s test flashes, ○, A.M.C., four experiments; ▵, T.D.L., four experiments; ⋄, O.A.R.M., eight experiments. For 0.02 Td s test flashes: , A.M.C., five experiments;
  T.D.L, one experiment. Error bars represent 1 s.e.m., and are only shown where they exceed the symbol size.

