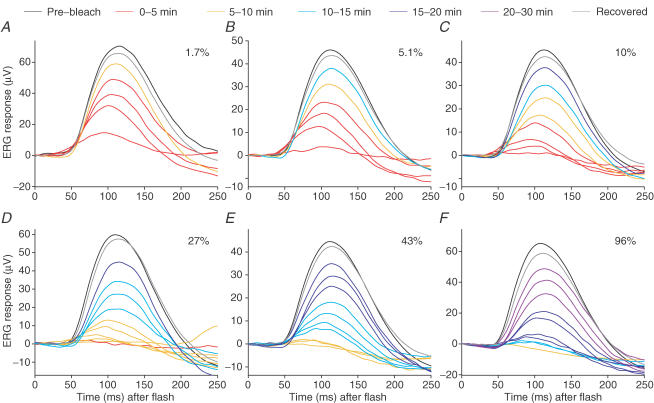
Figure 7. Recovery of b-wave responses following bleach delivery, for test flash of fixed intensity.
Each panel plots the b-wave response to a test flash of fixed intensity (0.1 Td s) at a series of times after extinction of a bleach, for subject A.M.C. In panels A–F, the calculated fractional bleaches were: 1.7, 5.1, 10, 27, 43 and 96%. The two largest responses in each panel are pre-bleach (black) and fully recovered (grey), and have been averaged over intervals of 5–10 min. Other responses during recovery (coloured traces) have been averaged from up to 16 traces recorded over intervals of 1 min, and the time window in which they were collected is indicated by colour coding (see legend key). To avoid overcrowding, traces for some post-bleach times have been omitted. After larger bleaches, little response was discernable for several minutes, and so in panels D–F the smallest response is the average of all traces falling within this ‘silent period’. The absolute amplitude (of pre-bleach and fully recovered responses) was different in the different panels, which were obtained in experiments over 4 days; these variations presumably resulted from differences in electrode position and differences in pupil diameter (range 5.9–7.9 mm) between experiments.

