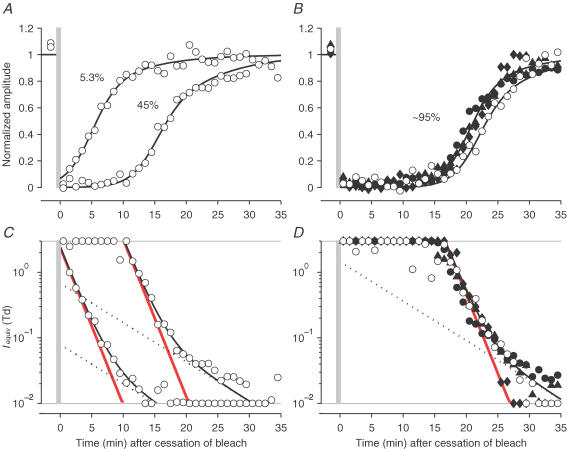
Figure 9. Dark adaptation of the b-wave and conversion to equivalent background intensity, for test flashes of two intensities.
Open symbols plot measurements obtained using the dimmer test flashes (0.02 Td s) for subject A.M.C. following bleaches of three levels, while filled symbols plot measurements using the brighter test flashes (0.1 Td s) for the three subjects following the largest bleach. Upper panels plot the normalized amplitude of the b-wave response, before, and up to 40 min after bleaches of 5.3, 45 and 92–96%; bleaches were delivered at least twice, with the exception of the 96% bleach illustrated for subject O.A.R.M. Lower panels plot the equivalent background intensities from the corresponding panels above, calculated as in Fig. 8 but using the half-desensitizing intensity appropriate for the test flash. A and C, for subject A.M.C., with flashes of 0.02 Td s, following bleaches of 5.3 and 45%. B and D, for all three subjects following a very large bleach. A.M.C., 96% bleach: dimmer flashes (○), brighter flashes (•). O.A.R.M., 96% bleach, brighter test flashes (♦). T.D.L., 92% bleach, brighter test flashes (▴). In each lower panel, the red line plots component ‘S2’, the dotted line plots component ‘S3’, and the curve plots their sum (see eqn (6)). The curves in the upper panels plot the same functions after transformation using eqn (4) with the appropriate value of I0.

