
Fig. 2.
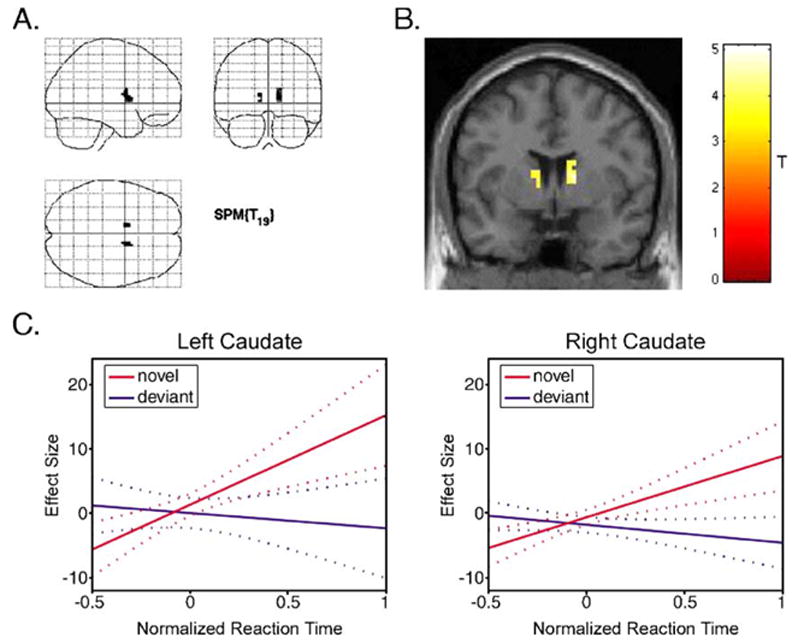
Brain regions where a correlation between BOLD activity and reaction times (to subsequent numerical task-stimuli) was significantly greater for the novel sounds compared to deviant tones. The only significant activations (P < 0.001 uncorrected; voxel extent = 10) were in the bilateral caudate (A) shown overlaid on a glass brain in three orthogonal planes and (B) shown overlaid on a coronal section (y = 3) of a structural template brain. (C) Graphical representations of the results in the left and right caudate are also shown. The plots demonstrate the fitted relationship between the effect sizes (parameter estimates) and the normalized reaction times to subsequent task-related stimuli for the novel sounds (red) and the deviant tones (blue). The effect size is expressed as percentage of the global mean intensity of the scans. The reaction times were normalized using a Euclidean Normalization method as implemented by SPM2. The dotted lines are 95% confidence intervals.