
Figure 3.
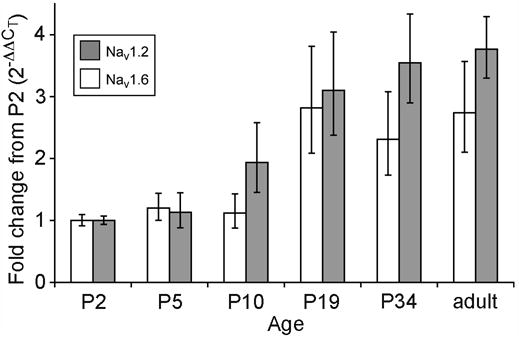
Developmental increase in steady-state levels of mRNA for Nav1.2 (white bars) and Nav1.6 (gray bars), estimated from the shift in Δ CT relative to P2. Each data point represents the mean of estimates from four RNA preparations. Error bars indicate ± 1 standard deviation. The levels for both Nav1.2 and Nav1.6 at P19, P34, and adulthood are significantly elevated compared to P2 (p < 0.03).