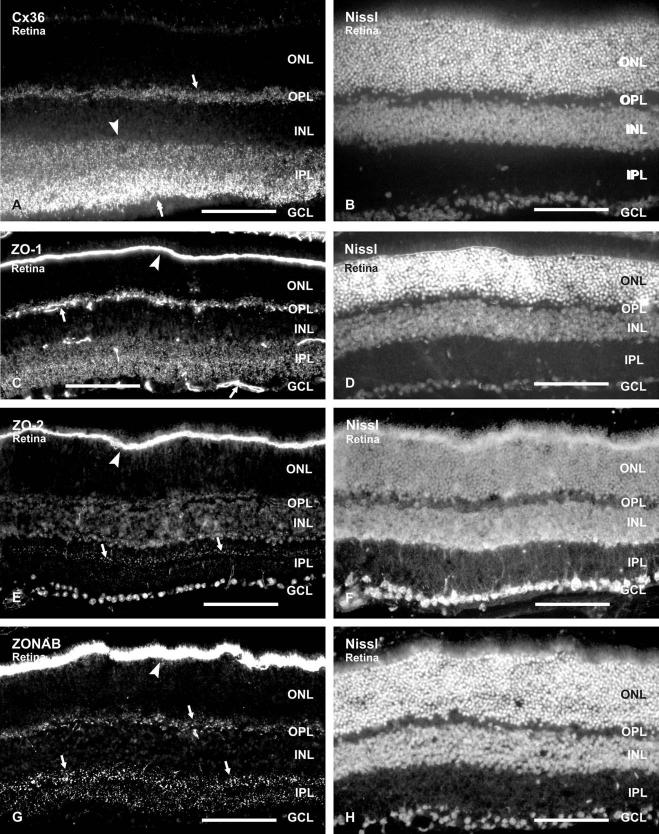
Fig. 1.
Relative densities of Cx36, ZO-1, ZO-2 and ZONAB in adult mouse retina. (A–H) Each pair of images (A, B), (C, D), (E, F) (G, H) shows fields of vertical retinal sections labeled by immunofluorescence for the proteins indicated (A, C, E, G) and the same fields counterstained with fluorescence Nissl Neurotrace (B, D, F, H, respectively). Labeling of each protein appears punctate, and ZO-1 is also evident along blood vessels (C, arrows). Cx36 is dense in the inner half of IPL (A, double arrow), and less dense in the outer half of IPL (A, arrowhead) and the OPL (A, arrow). ZO-1 is dense to moderate in both IPL and OPL (C). ZO-2 is sparse throughout the IPL, and is seen as a band of puncta in the outer IPL (E, arrows). ZONAB is moderate in both the IPL and OPL (G, arrows). The OLM is very densely labeled for ZO-1, ZO-2 and ZONAB (C, E, G, arrowheads). Scale bars=100 μm.

