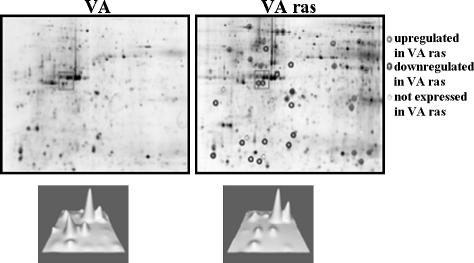
Figure 1.
Two-dimensional gel electrophoresis of VA and VArasmut cell lysates. Differentially expressed proteins are marked by circles. In the rectangles in the lower panel, the intensities of the respective spots are illustrated in 3D; the region shown corresponds to the rectangles in the upper panel.

