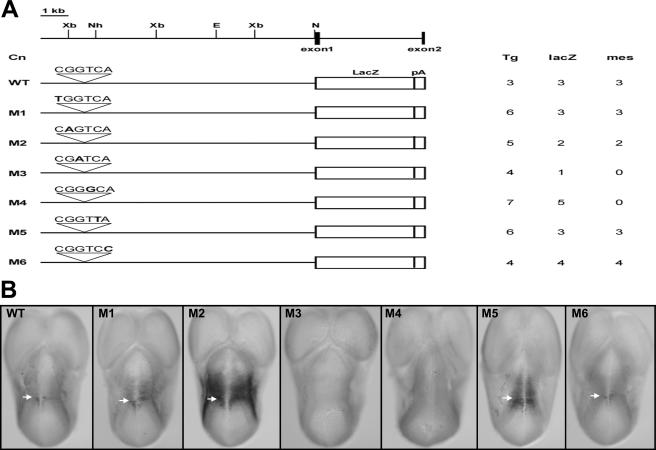
FIG. 3.
Functional analyses of a site essential for 180-bp enhancer activity in the context of the 10-kb ephA8 locus. (A) The top diagram depicts the restriction map of the genomic region of the ephA8 locus. EphA8 exons are shown as dark boxes. Restriction sites: E, EcoRI; N, NotI; X, XbaI. Below, microinjected genomic-DNA fragments are indicated as WT and M1 to M6. The sequences above the WT and M1 to M6 represent the wild-type and mutated sequences for a site essential for the 180-bp ephA8 enhancer activity, respectively. The introduced point mutation in each sequence is shown in boldface. Tg, number of G0 E11.5 transgenic embryos analyzed; lacZ, number of transgenics expressing lacZ; mes, number of transgenics expressing lacZ in the anterior mesencephalon. (B) Dorsal views of transgenic embryos (E11.5) stained for β-galactosidase activity. Anterior is at the top. The arrows indicate the diencephalon-mesencephalon junction region. Note that transgenic embryos carrying M3 and M4 show no lacZ expression in the anterior mesencephalon.

