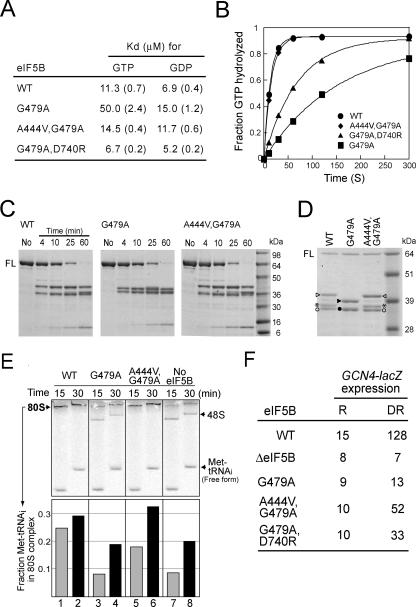
FIG. 2.
Biochemical analysis of eIF5B-G479A Switch II mutant and eIF5B-A444V,G479A and eIF5B-G479A,D740R suppressor mutants. (A) Summary of guanine nucleotide Kd values for eIF5B mutants. Values shown in parentheses are standard errors. (B) Results from a ribosome-dependent GTPase assay. Reaction mixtures containing 1 μM eIF5B, 0.4 μM 40S and 60S ribosomal subunits, and 50 nM [γ-33P]GTP were incubated at 30°C, and samples were quenched at the indicated times. Data were fit to the single exponential expression A[1 − exp(−kt)], in which A is the amplitude, k is the rate constant, and t is time. Fits were performed using KaleidaGraph (Synergy Software). The data presented are representative of results from at least three independent experiments. (C) Trypsin cleavage analysis of eIF5B. Recombinant WT or mutant forms of eIF5B396-1002 (3.5 μM) were digested with trypsin (100 nM), and reactions were stopped at the indicated times. Digestion products were analyzed by 4 to 20% SDS-PAGE (Tris-glycine buffer). Molecular mass markers are shown on the right. No, intact eIF5B396-1002 prior to trypsin cleavage; FL, full-length eIF5B396-1002. Results shown are representative of results from three independent experiments. (D) Trypsin cleavage analysis of eIF5B. Reactions were performed for 25 min as described for panel C, and products were analyzed by SDS-PAGE using 10% NuPAGE bis-Tris gels with MOPS buffer. N-terminal sequencing revealed that the peptide fragments marked by the triangles (closed or open) start at residue L689 (located in domain II), fragments marked by the asterisks start at residue L721 (located at the C-terminal end of domain II), and fragments marked by the circles (closed or open) start at the N terminus of eIF5B396-1002. Refer to Fig. 4 (upper panel) for the locations of the cleavage sites. (E) Results from the 80S complex formation assay. (Upper panel) Phosphorimage of a native gel for examining the ability of eIF5B to stimulate 80S complex formation. The progress of 80S complex formation was monitored in reactions with mixtures containing WT eIF5B, eIF5B-G479A, eIF5B-A444V,G479A, or no eIF5B by stopping the reactions at 15 and 30 min. The staggering of the bands is due to the fact that the samples were loaded at different times onto a running gel. The positions of 80S and 48S complexes and free [35S]Met-tRNAiMet are indicated. The data presented are representative of results from at least three independent experiments. (Lower panel) The amount of [35S]Met-tRNAiMet that was free or bound to 48S or 80S complexes was quantified, and the fraction of Met-tRNAiMet present in the 80S complexes relative to the total Met-tRNAiMet (80S + 48S + free) was calculated. (F) Analysis of GCN4-lacZ expression. The GCN4-lacZ plasmid p180 (10) was introduced into derivatives of strain J111 expressing WT eIF5B, eIF5B-G479A, eIF5B-A444V,G479A, or no eIF5B (ΔeIF5B). Cells were grown and β-galactosidase activity was determined as described previously (10), except that longer growth periods were required for sufficient quantities of cells from the slow-growing ΔeIF5B- and eIF5B-G479A-expressing strains. R, cells were grown under nonstarvation conditions in SD minimal medium where GCN4 expression is repressed; DR, cells were grown under amino acid starvation conditions (SD medium + 10 mM 3-aminotriazole) where GCN4 expression is normally derepressed. The β-galactosidase activities are the averages from three independent transformants and have standard errors of 30% or less.

