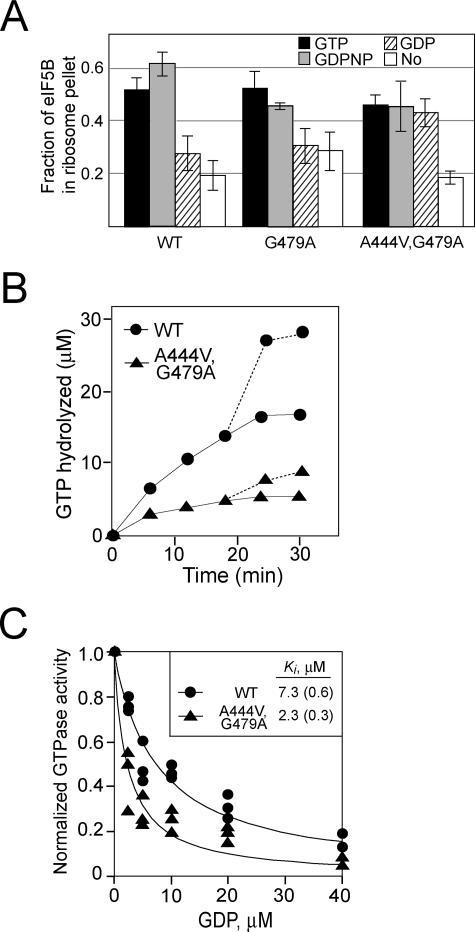
FIG. 3.
The GTPase switch regulating ribosomal affinity is altered in the eIF5B-A444V,G479A suppressor mutant. (A) Results of a ribosome-binding assay. Purified WT eIF5B, eIF5B-G479A, or eIF5B-A444V,G479A was mixed with purified yeast 80S ribosomes in the presence of GTP, GDPNP, GDP, or no nucleotide as indicated and then loaded onto a 10% sucrose cushion. Following centrifugation, the supernatant and ribosomal pellet fractions were analyzed by SDS-PAGE. The amounts of eIF5B recovered in the supernatant and pellet fractions were determined by quantitative densitometry, and the fraction of total recovered eIF5B present in the ribosomal pellet was calculated. The data presented are the averages of results from at least three independent experiments. (B) Time course of ribosome-dependent GTPase assay. Equal amounts of purified WT eIF5B or eIF5B-A444V,G479A (0.4 μM) were incubated with 50 μM [γ-33P]GTP in the presence of purified yeast 80S ribosomes (0.1 μM). Aliquots from the reaction mixtures were analyzed at various time points by thin-layer chromatography, and the amount of phosphate released was quantified. The values were corrected by subtracting the GTPase activities observed for the proteins in the absence of ribosomes. To test whether the loss of activity by eIF5B-A444V,G479A after 10 min was due to protein instability, fresh [γ-33P]GTP (50 μM) was added at 18 min and the release of phosphate was quantified (dotted lines). Results shown are representative of results from three independent experiments. (C) GDP inhibition of eIF5B GTPase activity. Increasing amounts of GDP, as indicated, were added to GTPase reaction mixtures containing 1 μM GTP, 50 nM 80S ribosomes, and 100 nM eIF5B or eIF5B-A444V,G479A. Reaction mixtures were incubated at 30°C for 5 min, phosphate release was quantified, and the values were normalized to the amount of phosphate released in assays with mixtures lacking GDP. Results shown are from three independent experiments, and the data were fit with the following expression by nonlinear regression using KaleidaGraph: 1 − [GDP]/(Ki + [GDP]). Numbers in parentheses are errors of the fits.

