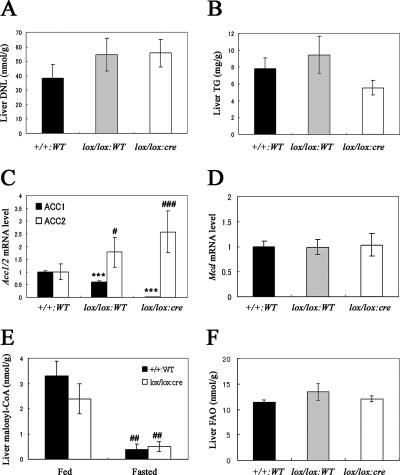
FIG. 3.
Key parameters related to the DNL pathway in the liver. (A) DNL and (B) TG levels in the livers obtained from Acc1+/+ WT (+/+:WT; black column; n = 10), Acc1lox(ex46)/lox(ex46) WT (lox/lox:WT; gray column; n = 9), and Acc1lox(ex46)/lox(ex46) TgFabpl-cre (lox/lox:cre; open column; n = 10) mice. (C) Relative Acc1 (black column) and Acc2 (open column) and (D) Mcd mRNA levels in the livers obtained from +/+:WT (n = 10), lox/lox:WT (n = 9), and lox/lox:cre (n = 10) mice. ***, P < 0.001 compared with +/+:WT (for Acc1); #, P < 0.05; ###, P < 0.001 compared with +/+:WT (for Acc2). (E) Malonyl-CoA level in the livers obtained from +/+:WT (black column; n = 5) and lox/lox:cre (open column; n = 6) mice fed with a normal chow diet or fasted for 16 h. ##, P < 0.01 for fed versus fasted groups within the same genotype. (F) FAO in the livers obtained from +/+:WT (black column; n = 10), lox/lox:WT (gray column; n = 9), and lox/lox:cre (open column; n = 11) mice. Each column represents average results ± standard errors.

