Abstract
Interleukin 6 (IL-6) is an independent predictor of type 2 diabetes and cardiovascular disease and is correlated with insulin resistance. Insulin stimulates nitric oxide (NO) production through the IRS-1/PI3-kinase/Akt/eNOS pathway (where IRS-1 is insulin receptor substrate 1, PI3-kinase is phosphatidylinositol 3-kinase, and eNOS is endothelial NO synthase). We asked if IL-6 affects insulin vasodilator action both in human umbilical vein endothelial cells (HUVEC) and in the aortas of C57BL/6J mice and whether this inhibitory effect was caused by increased Ser phosphorylation of IRS-1. We observed that IL-6 increased IRS-1 phosphorylation at Ser312 and Ser616; these effects were paralleled by increased Jun N-terminal protein kinase (JNK) and extracellular signal-regulated kinase 1/2 (ERK1/2) phosphorylation and reversed by JNK and ERK1/2 inhibition. In addition, IL-6 treatment resulted in impaired IRS-1 phosphorylation at Tyr612, a site essential for engaging PI3-kinase. Furthermore, IL-6 treatment reduced insulin-stimulated phosphorylation of eNOS at the stimulatory Ser1177 site and impaired insulin-stimulated eNOS dephosphorylation at the inhibitory Thr495 site. Insulin-stimulated eNOS activation and NO production were also inhibited by IL-6; these effects were reversed by inhibition of JNK and ERK1/2. Treatment of C57BL/6J mice with IL-6 resulted in impaired insulin-dependent activation of the Akt/eNOS pathway in the aorta as a result of JNK and ERK1/2 activation. Our data suggest that IL-6 impairs the vasodilator effects of insulin that are mediated by the IRS-1/PI3-kinase/Akt/eNOS pathway through activation of JNK and ERK1/2.
Development of atherosclerotic cardiovascular disease (CVD) is the main complication in type 2 diabetes mellitus, but clinical CVD can also precede the development of diabetes, leading to the hypothesis that type 2 diabetes and CVD share common antecedents (17, 36). Insulin resistance has been considered a plausible candidate for this common antecedent, but specific mechanisms whereby insulin resistance leads to both type 2 diabetes and CVD remain unsettled (15). Chronic subclinical inflammation could be a unifying mechanistic factor because it is a precursor of CVD, is associated with insulin resistance, and precedes the development of type 2 diabetes (11, 25, 28). Acute-phase reactants, like C-reactive protein (CRP), and their chief inductor, the proinflammatory cytokine interleukin 6 (IL-6), have been shown to be powerful independent risk predictors of both type 2 diabetes and CVD (26, 31). A specific mechanism whereby inflammation may contribute to these disease processes is induction of endothelial dysfunction, placing the vascular endothelium in a key unifying position for the shared pathogenesis of CVD and type 2 diabetes (27). Endothelial dysfunction is regarded as a causal factor in the development of atherothrombotic disease and as one of the earliest abnormalities that can be detected clinically in people at risk for atherosclerosis (20, 24). Endothelial dysfunction is found in subjects with insulin resistance, in type 2 diabetes patients, and in their first-degree relatives and independently predicts the future development of type 2 diabetes (3, 21, 35). While the term endothelial dysfunction encompasses several potential abnormalities, of particular significance in this context is the reduced bioavailability of the signaling molecule nitric oxide (NO), which has potent vasodilatory and antiatherosclerotic properties (22). It has recently emerged that the endothelium is a target tissue of insulin, and insulin resistance can therefore exist at the level of the endothelial cell (34, 37, 38). Insulin promotes vasodilatation by activating the signaling pathway involving the insulin receptor (IR)/insulin receptor substrate 1 (IRS-1)/phosphatidylinositol 3-kinase (PI3-kinase)/Akt that leads to the activation of endothelial nitric oxide synthase (eNOS) (23, 37). This signaling pathway has similarities to the one that mediates insulin-stimulated glucose uptake in tissues implicated in glucoregulation, such as skeletal muscle (30). Inflammatory cytokines such as IL-6 have been found to be involved in the pathogenesis of both insulin resistance and atherosclerosis (11, 25, 26, 31). Only a few studies have addressed the potential detrimental effects of IL-6 on the insulin signaling pathway and/or its ability to modify insulin sensitivity and action (18, 19, 29, 32, 33). These studies have shown that IL-6 impairs insulin signal transduction in hepatocytes and adipocytes. However, the potential role of IL-6 in vascular insulin action is still unsettled. The present study was designed to investigate if IL-6 affects insulin signaling involved in the production of NO in human endothelial cells.
MATERIALS AND METHODS
The complete list of antibodies and other reagents used is available on request.
Insulin signaling studies on HUVECs.
Human umbilical vein endothelial cells (HUVECs) were cultured for 18 h in serum-deprived medium and incubated for the periods of time indicated in Fig. 1 in the presence or absence of IL-6. In experiments with cell-permeating Jun N-terminal protein kinase (JNK) inhibitor I (20 mol/liter) or PD98059 (50 nmol/liter), these were added to cells 30 min before the addition of IL-6. In experiments with small interfering RNAs (siRNAs), HUVECs were transfected with the validated stealth siRNA against each target using Lipofectamine 2000 reagent (Invitrogen Co., Carlsbad, CA), according to the manufacturer's protocol, 72 h before IL-6 treatment. For insulin stimulation experiments, insulin was then added for 10 min at 100 nmol/liter. Equal amounts of cell lysates were then subjected to either immunoprecipitation with the appropriate antibody (anti-IRS-1, anti-IRS-2, or anti-IR) or to direct immunoblotting, as described previously (2). To normalize the blots for protein levels, the blots were stripped and reprobed with primary antibodies against the total unphosphorylated form of the appropriate protein or beta-actin.
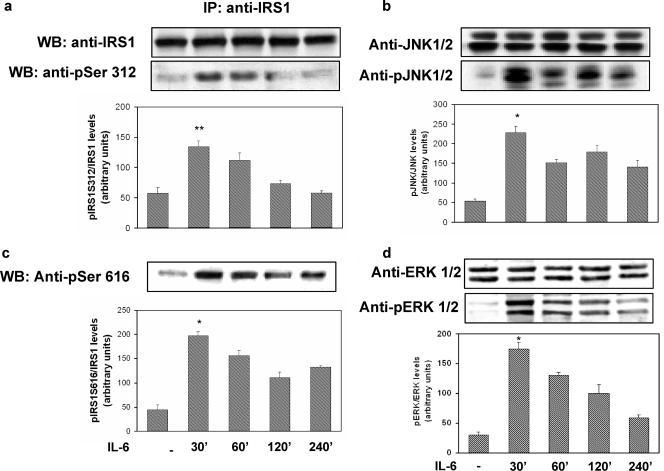
FIG. 1.
Time course of the effects of IL-6 on IRS-1, JNK, and ERK1/2 phosphorylation in HUVECs. The HUVECs were incubated with 20 ng/ml of IL-6 for the times indicated at the bottom, and cell lysates were subjected to Western blot analysis as indicated in Materials and Methods. (a) Ser312 phosphorylation of IRS-1 (lower blot) and total levels of IRS-1 (upper blot). (b) JNK phosphorylation (lower blot) and total levels of JNK (upper blot). IP, immunoprecipitation. (c) Ser616 phosphorylation of IRS-1. (d) ERK1/2 phosphorylation (lower blot) and total levels of ERK1/2 (upper blot). Each bar represents the mean ± SD of three independent experiments; the blots shown are from representative experiments. WB, Western blot. **: P < 0.01. *: levels in IL-6-treated cells versus levels in non-IL-6-treated cells; P < 0.02.
PI3-kinase activity in the immunoprecipitates was assayed with phosphatidylinositol as the substrate, according to a previously described method (2). The PI3-phosphate products were visualized by autoradiography, identified by their comigration with a PI4-phosphate standard (Calbiochem, La Jolla, CA), and quantified by scanning densitometry.
Determination of PP1 activity.
HUVECs were serum starved for 18 h and incubated in the presence or absence of the indicated hormones and inhibitors. Protein phosphatase 1 (PP1) activity was assayed using a ProFluor Ser/Thr phosphatase assay (Promega, WI), according to the manufacturer's instructions.
NOS activity and NO release.
NOS activity was determined in whole-cell lysates of HUVECs using a NOS detection system (Sigma, Saint Louis, MO), which measures the ability of NOS to convert l-[14C]arginine (Amersham) to l-[14C]citrulline, according to the manufacturer's instructions. Data were normalized by the amount of protein and the reaction time. NO released in the medium by HUVECs was assessed by measuring the conversion of nitrate to nitrite and spectrophotometrically detecting the total nitrite as a colored azo dye product of the Griess reaction by using an R&D Systems total nitric oxide assay, according to the manufacturer's instructions.
In vivo insulin stimulation.
Three-month-old C57BL/6J mice were obtained from Charles River and maintained as described previously (9). The mice were fasted overnight before the experiments. For IL-6 treatment, the mice were injected intraperitoneally (i.p.) with recombinant human IL-6 (rhIL-6; R&D Systems) diluted in saline solution 1 h before insulin injection. In experiments using JNK inhibitor I or PD98059, these were injected i.p. at 10 mg/kg of body weight 2 h before IL-6 injection. Animals were then stimulated with insulin (i.p., 0.75 mU/g of body weight) and sacrificed with sodium pentobarbital (40 mg/kg of body weight) injection as reported previously (26). The aortas were immediately collected and snap-frozen in liquid nitrogen; insulin signaling studies were then performed on aortic lysates as described above. A total of 30 mice were used for this study (including preliminary time-course experiments).
Statistical analysis.
All results are given as the mean ± standard deviation (SD). Student's t test was used to compare results. A P value of ≤0.05 was considered statistically significant.
RESULTS
Effects of IL-6 on site-specific serine phosphorylation of IRS-1.
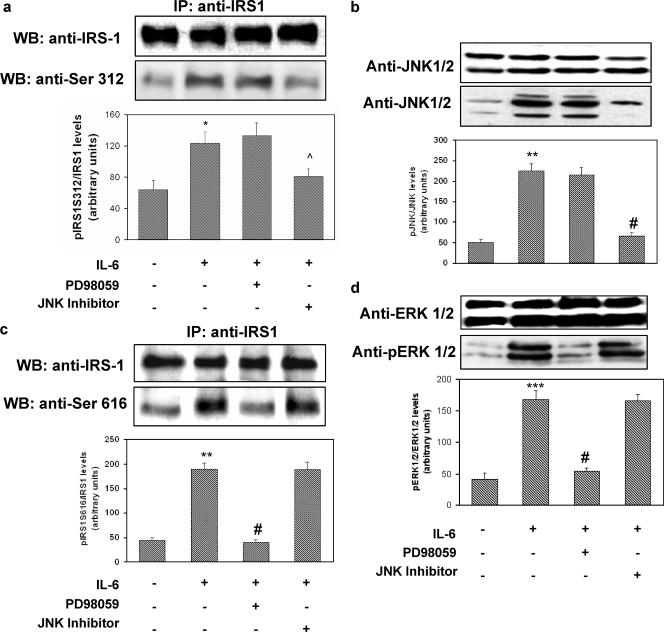
To determine the time and dose dependence of IL-6 action on HUVECs, we examined its effect on STAT-3 tyrosine phosphorylation. IL-6-stimulated STAT-3 phosphorylation reached its peak after 30 min of incubation. By contrast, we did not observe any effect of insulin on STAT-3 phosphorylation after 15 min of incubation. The effect of IL-6 on STAT-3 tyrosine phosphorylation was dose dependent, with the maximal effect occurring at 20 ng/ml (data not shown). Increased serine phosphorylation of IRS-1 has been shown to inhibit its ability to be tyrosine phosphorylated by the IR and to bind and activate PI3-kinase (1, 4, 5, 16). Specifically, it has been shown that JNK phosphorylates human IRS-1 at Ser312 and extracellular signal-regulated kinase 1/2 (ERK1/2) at Ser616 (1, 4, 5, 16). As shown in Fig. 1a and c, exposure of HUVECs to IL-6 (20 ng/ml) resulted in a time-dependent increase in IRS-1 phosphorylation at both Ser312 and Ser616, with the maximal effects occurring after 30 min of incubation. These stimulatory effects of IL-6 were paralleled by time-dependent increases in the phosphorylation of JNK and ERK1/2, respectively (Fig. 1b and d). IL-6-induced phosphorylation of IRS-1 at Ser312 and Ser616 was reversed by treatment with the cell-permeating JNK inhibitor I and PD98059 (a reversible inhibitor of MEK1, the enzyme that directly activates ERK1/2), respectively (Fig. 2a and c). JNK inhibitor I and PD98059 also blocked IL-6-induced phosphorylation of JNK and ERK1/2, respectively (Fig. 2b and d). By contrast, JNK inhibitor I did not affect ERK1/2 phosphorylation, and PD98059 did not affect JNK phosphorylation in response to IL-6, thus indicating that their inhibitory activities were specific (Fig. 2c and d).
FIG. 2.
Reversibility of the effects of IL-6 on IRS-1, JNK, and ERK1/2 phosphorylation in HUVECs. HUVECs were incubated for 30 min in the presence or absence of 20 ng/ml of IL-6. In the experiments using cell-permeating JNK inhibitor I (20 mol/liter) or PD98059 (50 nmol/liter), these were added to the cells 30 min before the addition of IL-6. Cell lysates were subjected to Western blot analysis as indicated in Materials and Methods. (a) Ser312 phosphorylation of IRS-1 (lower blot) and total levels of IRS-1 (upper blot). (b) JNK phosphorylation (lower blot) and total levels of JNK (upper blot). (c) Ser616 phosphorylation of IRS-1. (d) ERK1/2 phosphorylation (lower blot) and total levels of ERK1/2 (upper blot). Each bar represents the mean ± SD of 4 independent experiments; the blots shown are from representative experiments. IP, immunoprecipitation; WB, Western blot. *: P < 0.05. **: P < 0.02. ***: levels in insulin-stimulated cells versus basal levels; P < 0.01. ^: P < 0.05. #: levels in insulin-stimulated, IL-6-treated cells versus levels in non-IL-6-treated, insulin-stimulated cells; P < 0.01. +: present. −: absent.
The use of either JNK inhibitor 1 or PD98059 or a combination of both did not affect IL-6-stimulated STAT-3 phosphorylation (data not shown).
Effects of IL-6 on insulin-stimulated tyrosine phosphorylation of IR, IRS-1, and IRS-2 and PI3-kinase activation.
Because serine phosphorylation of IRS-1 converts IRS-1 into an inhibitor of the intrinsic IR tyrosine kinase (30), we tested the possibility that increased Ser312 and Ser616 phosphorylation induced by IL-6 would be associated with impaired insulin-stimulated tyrosine phosphorylation of the receptor both at the Tyr1158/Tyr1162/Tyr1163 sites in the active loop of the catalytic domain of the receptor and at the Tyr972 site in the juxtamembrane region that creates an NPXpX recognition motif for the phosphotyrosine binding domain of the IRS proteins. Insulin stimulated Tyr1158/Tyr1162/Tyr1163 phosphorylation 2.3-fold (basal levels versus levels in insulin-stimulated cells; P < 0.01) and Tyr972 phosphorylation 1.9-fold (levels in insulin-stimulated cells versus basal levels; P < 0.01). IL-6 (20 ng/ml) treatment reduced insulin-stimulated Tyr1158/Tyr1162/Tyr1163 phosphorylation by 32% (levels in insulin-stimulated IL-6-treated cells versus levels in non-IL-6-treated insulin-stimulated cells; P < 0.01) and insulin-stimulated Tyr972 phosphorylation by 30% (levels in insulin-stimulated, IL-6-treated cells versus levels in non-IL-6-treated, insulin-stimulated cells; P < 0.01) (data not shown). The inhibitory effects of IL-6 both on Tyr1158/Tyr1162/Tyr1163 and on Tyr972 phosphorylation were reversed by both JNK inhibitor I and PD98059 (data not shown). It has been reported that IL-6-dependent insulin resistance is mediated, at least in part, by the induction of suppressor of cytokine signaling-3 (SOCS-3), a member of the SOCS protein family which associates with the IR, resulting in inhibition of its activation. SOCS-3 expression was not induced by IL-6 during the time frame of its maximal effect on STAT-3 activation (data not shown).
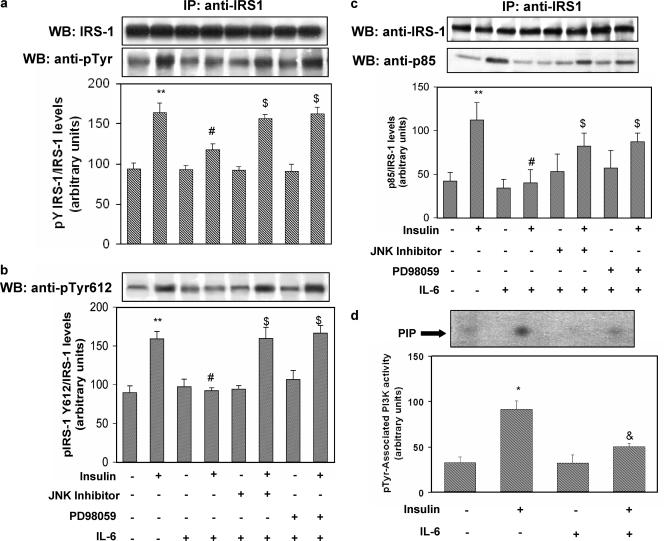
As shown in Fig. 3a, exposure of HUVECs to IL-6 (20 ng/ml) resulted in 30% inhibition of insulin-stimulated tyrosine phosphorylation of IRS-1. The inhibitory effect of IL-6 was reversed by treatment with JNK inhibitor I and PD98059. To test the possibility that impaired IRS-1/p85 association induced by IL-6 was related to changes in phosphorylation states of the YXXM motifs at position 612 (Tyr612), which plays a major role in engaging the p85 subunit of PI3-kinase (8), IRS-1 was immunoprecipitated from cell lysates and immunoblotted with phosphospecific anti-Tyr612. As shown in Fig. 3b, insulin stimulated phosphorylation of Tyr612 on IRS-1 1.8-fold (levels in insulin-stimulated cells versus basal levels; P < 0.01). IL-6 treatment reduced insulin-stimulated phosphorylation of Tyr612 by 45% (levels in insulin-stimulated, IL-6-treated cells versus levels in insulin-stimulated, non-IL-6-treated cells; P < 0.01). The inhibitory effect of IL-6 was reversed by treatment with JNK inhibitor I and PD98059 (Fig. 3b). Because association of the p85 regulatory subunit of PI3-kinase with tyrosine-phosphorylated IRS-1 is essential to promote downstream signaling, the effect of IL-6 on IRS-1/p85 association was examined. Insulin stimulated the binding of IRS-1 to the p85 subunit 2.6-fold (levels in insulin-stimulated cells versus basal levels; P < 0.01) (Fig. 3c). IL-6 treatment reduced insulin-stimulated binding of IRS-1 to the p85 subunit by 64% (levels in insulin-stimulated, IL-6-treated cells versus levels in insulin-stimulated, non-IL-6-treated cells; P < 0.01). This inhibitory effect of IL-6 was partially reversed by treatment with either JNK inhibitor I or PD98059 (Fig. 3c). According to these results, exposure of HUVECs to IL-6 resulted in a 44% decrease in PI3-kinase activity associated with phosphotyrosine immunoprecipitates (Fig. 3d).
FIG. 3.
Effect of IL-6 on insulin-stimulated IRS-1 tyrosine phosphorylation and association with the p85 subunit of PI3-kinase and PI3-kinase activation in HUVECs. HUVECs were treated with IL-6 in the presence or absence of JNK inhibitor I or PD98059 as indicated in Fig. 2. Where specified, 100 nmol/liter insulin was then added for 10 min. Equal amounts of cell lysates were subjected to either immunoprecipitation (IP) with the indicated antibody or to direct immunoblotting. To normalize the blots for protein levels, blots were stripped and reprobed with primary antibodies against the total unphosphorylated form of the indicated protein. PI3-kinase activity was assayed in the immunoprecipitates as described in Materials and Methods. (a) Tyrosine phosphorylation of IRS-1 (lower blot) and total levels of IRS-1 (upper blot). (b) Tyr612 IRS-1 phosphorylation. (c) Association of IRS-1 with the p85 subunit (lower blot) and total levels of IRS-1 (upper blot). (d) PI3-kinase activity associated with phosphotyrosine immunoprecipitates. Each bar represents the mean ± SD of at least 3 independent experiments; the blots shown are from representative experiments. WB: Western blot. **: P < 0.02. *: levels in insulin-stimulated cells versus basal levels; P < 0.01. #: P < 0.01. &: levels in insulin-stimulated, IL-6-treated cells versus levels in non-IL-6-treated, insulin-stimulated cells; P < 0.02. $: levels in IL-6-treated cells that were insulin stimulated in the presence of PD98059 or JNK inhibitor versus levels in IL-6-treated, insulin-stimulated cells; P < 0.01. +: present. −: absent.
By contrast, we did not observe significant effects of IL-6 treatment on Tyr phosphorylation of IRS-2, another key mediator of insulin signaling (data not shown). These data are in keeping with previous observations (2, 10) suggesting that insulin effects on the endothelium are mainly mediated through IRS-1.
Effects of IL-6 on insulin-stimulated activation of Akt, eNOS, and protein phosphatase 1.
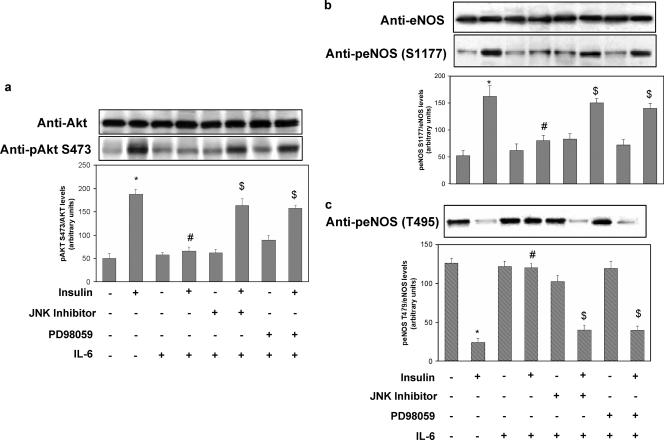
Evidence has been provided indicating that insulin regulates NO production via a pathway involving PI3-kinase-dependent activation of Akt, which in turn leads to activation of eNOS (23, 38). Therefore, we tested whether IL-6 would affect the activation of the insulin-stimulated Akt/eNOS pathway. Insulin stimulated Ser473 Akt phosphorylation 3.6-fold (P < 0.01) (Fig. 4a). IL-6 (20 ng/ml) treatment reduced insulin-stimulated Ser473 Akt activation by 62% (levels in insulin-stimulated cells versus basal levels; P < 0.01). These inhibitory effects of IL-6 were reversed by JNK inhibitor I and PD98059 (Fig. 4a). eNOS activity is regulated by phosphorylation at multiple sites, but two of the better-characterized sites are serine 1177 (Ser1177) and threonine 495 (Thr495). Ser1177 is rapidly phosphorylated by Akt in response to insulin, resulting in increased eNOS activity and NO production (7, 14). By contrast, Thr495 is constitutively phosphorylated in endothelial cells, and it is thought to be a negative regulatory site causing a decrease in enzyme activity (12, 13). Insulin increased phosphorylation of eNOS on Ser1177 three-fold (levels in insulin-stimulated cells versus basal levels; P < 0.01) (Fig. 4b). IL-6 treatment resulted in a 49% decrease of insulin-stimulated Ser1177 eNOS phosphorylation (levels in IL-6-treated, insulin-stimulated cells versus levels in non-IL-6-treated, insulin-stimulated cells; P < 0.01). Treatment of HUVECs with JNK inhibitor I or PD98059 reversed the inhibitory effect of IL-6 (Fig. 4b). In the absence of insulin, eNOS was phosphorylated on Thr495 (Fig. 4c, lane 1), while insulin caused a 75% reduction in eNOS Thr495 phosphorylation (P < 0.01) (Fig. 4c, lane 2). IL-6 (20 ng/ml) treatment resulted in an 80% inhibition of insulin-induced dephosphorylation of Thr495 (levels in IL-6-treated, insulin-stimulated cells versus levels in non-IL-6-treated, insulin-stimulated cells; P < 0.01) (Fig. 4c, lane 4). These effects of IL-6 were reversed by treatment of HUVECs with either JNK inhibitor I or PD98059, which restored Thr495 eNOS phosphorylation to levels comparable to that observed with insulin alone (Fig. 4c, lanes 6 and 8, respectively). There is evidence that PP1 is involved in dephosphorylation of Thr495, and inhibition of PP1 by calyculin-A has been shown to enhance phosphorylation of Thr495 (12). We therefore inquired whether calyculin-A affects dephosphorylation of eNOS Thr495 induced by insulin. Treatment with calyculin-A prevented the insulin-induced dephosphorylation of Thr495 (data not shown). Insulin has been shown to activate PP1 via a PI3-kinase-dependent pathway in rat cardiomyocytes (6). Therefore, we tested whether insulin would also increase PP1 activity in HUVECs and whether IL-6 would affect insulin-stimulated PP1 activation. Insulin stimulated PP1 activity two-fold, whereas treatment with PI3-kinase inhibitors wortmannin or LY-294002 blocked this effect (data not shown) in parallel with the inhibition of insulin-induced eNOS Thr495 dephosphorylation (data not shown). IL-6 treatment blocked insulin-stimulated PP1 activation (levels in IL-6-treated, insulin-stimulated cells versus levels in non-IL-6-treated, insulin-stimulated cells; P < 0.01) (data not shown), whereas treatment of HUVECs with JNK inhibitor I or PD98059 partly reversed the inhibitory effects of IL-6 on insulin-stimulated PP1 activation (data not shown). Simultaneous incubation with both JNK inhibitor I and PD98059 completely restored the stimulatory effects of insulin on PP1 (data not shown).
FIG. 4.
Effects of IL-6 on insulin-stimulated Akt and eNOS phosphorylation in HUVECs. HUVECs were cultured for 18 h in serum-deprived medium and incubated for 30 min in the presence or absence of 20 ng/ml IL-6. In experiments with cell-permeating JNK inhibitor I (20 mol/liter), or PD98059 (50 nmol/liter), these were added to cells 30 min before IL-6 addition. When specified, insulin was then added for 10 min at 100 nmol/liter. Equal amounts of cell lysates were subjected to Western blotting with the appropriate specific phosphoantibody as described in Materials and Methods. To normalize the blots for protein levels, the blots were stripped and reprobed with primary antibodies against the total unphosphorylated form of the indicated protein. (a) Ser473 Akt phosphorylation (lower blot) and total levels of Akt (upper blot). (b) Ser1177 eNOS phosphorylation (lower blot) and total levels of eNOS (upper blot). (c) Thr495 eNOS phosphorylation. Each bar represents the mean ± SD of three independent experiments; the blots shown are from representative experiments. *: levels in insulin-stimulated cells versus basal levels; P < 0.01. #: levels in insulin-stimulated, IL-6-treated cells versus levels in non-IL-6-treated, insulin-stimulated cells; P < 0.01. $: levels in IL-6-treated, insulin-stimulated cells incubated in the presence of PD98059 or JNK inhibitor versus levels in IL-6-treated, insulin-stimulated cells; P < 0.01. +: present. −: absent.
Effects of IL-6 on insulin-stimulated eNOS activity.
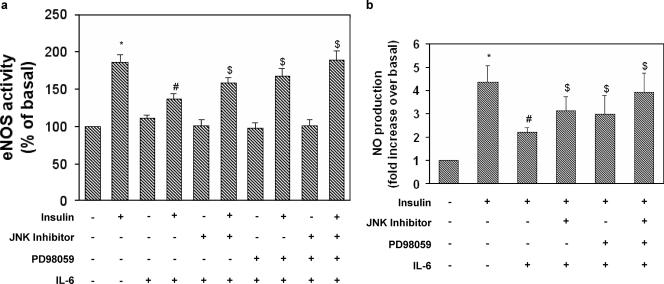
We next determined whether IL-6 would affect eNOS activation induced by insulin. Insulin stimulated eNOS activity two-fold (Fig. 5a, lane 2). IL-6 (20 ng/ml) treatment resulted in a 30% decrease of insulin-stimulated eNOS activity (levels in IL-6 treated, insulin-stimulated cells versus levels in non-IL-6-treated, insulin-stimulated cells; P < 0.02) (Fig. 5a, lane 4). Treatment of HUVECs with JNK inhibitor or PD98059 partially reversed the inhibitory effects of IL-6 on insulin-stimulated eNOS activity (Fig. 5a, lanes 6 and 8, respectively), whereas simultaneous incubation with both inhibitors completely restored the stimulatory effects of insulin (Fig. 5a, lane 10).
FIG. 5.
Reversibility of the effects of IL-6 on insulin-stimulated NOS activity in HUVECs. NOS activity was determined in cell lysates of HUVECs using a NOS detection system according to the manufacturer's instructions. Data were normalized by the amount of protein and reaction time. NO released in the medium by HUVECs was assessed by measuring the conversion of nitrate to nitrite and spectrophotometrically detecting total nitrite as a colored azo dye product of the Griess reaction according to the manufacturer's instructions. (a) Effects of JNK and MEK1 inhibitors on IL-6-induced inhibition of NOS activity. (b) Effects of JNK and MEK1 inhibitors on IL-6-induced inhibition of NO production. Each bar represents the mean ± SD of three independent experiments; the results of representative experiments are shown. *: levels in insulin-stimulated cells versus basal levels; P < 0.01. #: levels in insulin-stimulated IL-6-treated cells versus levels in non-IL-6-treated, insulin-stimulated cells; P < 0.01. $: levels in IL-6-treated, insulin-stimulated cells incubated in the presence of either PD98059 or JNK inhibitor or both versus levels in IL-6-treated, insulin-stimulated cells; P < 0.01. +: present. −: absent.
eNOS activity assays measuring the conversion of arginine to citrulline are performed in the presence of optimal calcium and cofactors and do not always accurately reflect the production rate of NO in intact cells. Therefore, we examined the effect of IL-6 on the ability of eNOS to produce NO in intact cells under basal or insulin-stimulated conditions. Insulin stimulated NO release 4.3-fold (Fig. 5b, lane 2). IL-6 (20 ng/ml) treatment resulted in a 50% decrease of insulin-stimulated NO release (levels in IL-6-treated, insulin-stimulated cells versus levels in non-IL-6-treated, insulin-stimulated cells; P < 0.01) (Fig. 5b, lane 3). Treatment of HUVECs with PD98059 or JNK inhibitor I partially reversed the inhibitory effects of IL-6 on insulin-stimulated NO release (Fig. 5b, lanes 4 and 5, respectively), whereas simultaneous incubation with both inhibitors completely restored the stimulatory effects of insulin (Fig. 5b, lane 6).
IL-6 effects are reversed by ERK1/2 and JNK1/2 knock-down with specific stealth siRNAs.
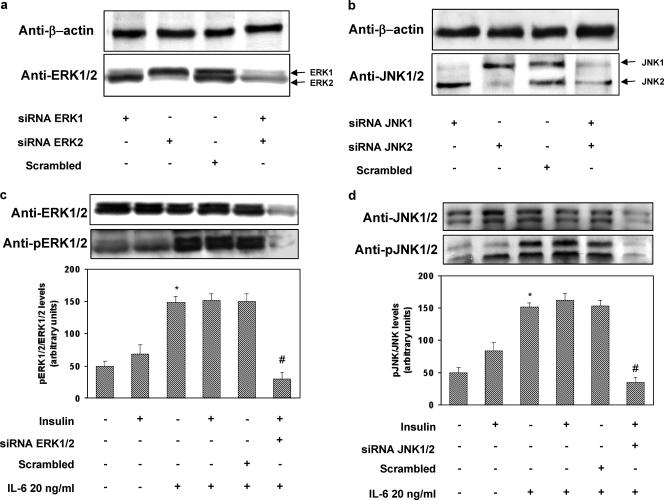
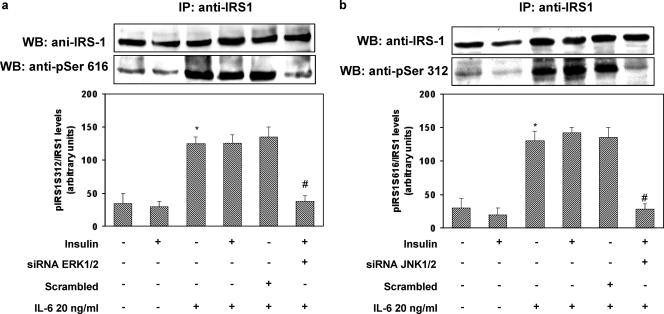
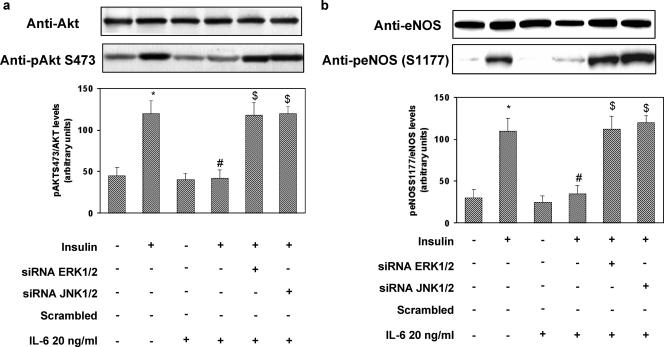
In order to exclude the possibility that our results were due to secondary effects of the chemical inhibitors, we transfected HUVECs with isoform-specific stealth siRNA constructs to inhibit the expression of ERK1 (construct 1), ERK2 (construct 2), JNK1 (construct 3), and JNK2 (construct 4). First, we confirmed that these siRNA sequences were able to specifically downregulate the expression of their target protein without affecting other proteins (Fig. 6a and b). Cotransfection of HUVECs with constructs 1 and 2 resulted in inhibition of IL-6-induced ERK1/2 phosphorylation (Fig. 6c). Similarly, cotransfection of HUVECs with constructs 3 and 4 abolished IL-6-induced JNK1/2 phosphorylation (Fig. 6d). Knockdown of ERK1/2 with constructs 1/2 blocked IL-6-induced phosphorylation of IRS-1 at Ser616, while knockdown of JNK1/2 with constructs 3/4 abolished IL-6-induced phosphorylation of IRS-1 at Ser312 (Fig. 7a and b). Paralleling these results, knockdown of ERK1/2 with constructs 1 and 2 or of JNK1/2 with constructs 3 and 4 reversed the inhibitory effects of IL-6 on insulin-induced phosphorylation of Akt and eNOS (Fig. 8a and b).
FIG. 6.
Effects of stealth siRNA on ERK1/2 and JNK levels and phosphorylation in HUVECs. The HUVECs were seeded in a 6-well plate such that they would be 50 to 60% confluent at the time of transfection. The day after, the cells were transfected according to the manufacturer's protocol in antibiotic-free and serum-free Dulbecco's modified Eagle medium with Lipofectamine 2000 (3.5 μl/ml) and each stealth siRNA (100 nM) or the pooled Erk1-Erk2 siRNAs (200 nM) and JNK1-JNK2 siRNAs (200 nM); a scrambled siRNA was used as a negative control. After 4 h, 1 volume of complete growth medium was added. Seventy-two hours posttransfection, the cells were serum starved for 4 h, stimulated with IL-6 and insulin, and analyzed as described in Materials and Methods. Each bar represents the mean ± SD of four independent experiments; the blots shown are from representative experiments. (a) Total levels of ERK1/2 (lower blot) and levels of beta-actin (upper blot). (b) Total levels of JNK (lower blot) and levels of beta-actin (upper blot). (c) ERK1/2 phosphorylation (lower blot) and total levels of ERK1/2 (upper blot). (d) JNK phosphorylation (lower blot) and total levels of JNK (upper blot). *: levels in IL-6-treated versus levels in non-IL-6-treated cells; P < 0.01. #: levels in insulin-stimulated, IL-6-treated, specific-siRNA-transfected cells versus levels in insulin-stimulated, IL-6-treated cells transfected with a scrambled siRNA; P < 0.01. +: present. −: absent.
FIG. 7.
Effects of stealth siRNA ERK1/2 or JNK1/2 on insulin-stimulated IRS-1 phosphorylation in HUVECs. HUVECs were transfected according to the manufacturer's protocol in antibiotic-free and serum-free Dulbecco's modified Eagle medium with Lipofectamine 2000 (3.5 μl/ml) and each stealth siRNA (100 nM) or the pooled Erk1-Erk2 siRNAs (200 nM) and JNK1-JNK2 siRNAs (200 nM); a scrambled siRNA was used as a negative control. The cells were then incubated for 30 min in the presence or absence of 20 ng/ml of IL-6. Cell lysates were subjected to Western blot analysis as indicated in Materials and Methods. Each bar represents the mean ± SD of four independent experiments; the blots shown are from representative experiments. (a) Ser616 phosphorylation of IRS-1 (lower blot) and total levels of IRS-1 (upper blot); (b) Ser312 phosphorylation of IRS-1 (lower blot) and total levels of IRS-1 (upper blot). IP, immunoprecipitation; WB, Western blot. *: levels in IL-6-treated versus levels in non-IL-6-treated cells; P < 0.01. #: levels in insulin-stimulated, IL-6-treated, specific-siRNA-transfected cells versus levels in insulin-stimulated, IL-6-treated cells transfected with a scrambled siRNA; P < 0.01. +: present. −: absent.
FIG. 8.
Effects of stealth siRNA ERK1/2 or JNK1/2 on insulin-stimulated Akt and eNOS phosphorylation in HUVECs. HUVECs were transfected according to the manufacturer's protocol in antibiotic-free and serum-free Dulbecco's modified Eagle medium with Lipofectamine 2000 (3.5 μl/ml) and pooled Erk1-Erk2 siRNAs (200 nM) or JNK1-JNK2 siRNAs (200 nM); a scrambled siRNA was used as a negative control. The cells were then incubated for the indicated period of time in the presence or absence of 20 ng/ml of IL-6. Cell lysates were subjected to Western blot analysis as indicated in Materials and Methods. (a) Ser473 Akt phosphorylation (lower blot) and total levels of Akt (upper blot). (b) Ser1177 eNOS phosphorylation (lower blot) and total levels of eNOS (upper blot). Each bar represents the mean ± SD of three independent experiments; the blots shown are from representative experiments. *: P < 0.01, levels in insulin-stimulated cells versus basal levels. #: levels in insulin-stimulated, IL-6-treated cells versus levels in non-IL-6-treated, insulin-stimulated cells; P < 0.01. $: levels in IL-6-treated, insulin-stimulated cells transfected with either ERK1/2 siRNA or JNK3/4 versus levels in IL-6-treated, insulin-stimulated cells transfected with a scrambled siRNA; P < 0.01. +: present. −: absent.
Effects of IL-6 on insulin-stimulated activation of Akt and eNOS in aortas from C57BL/6J mice.
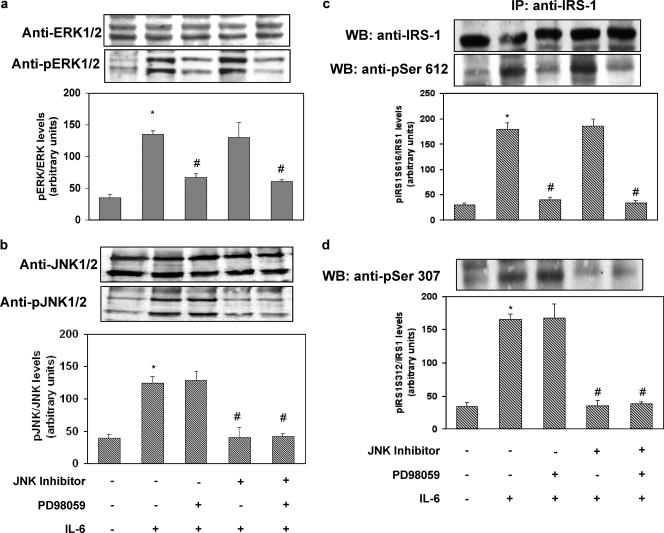
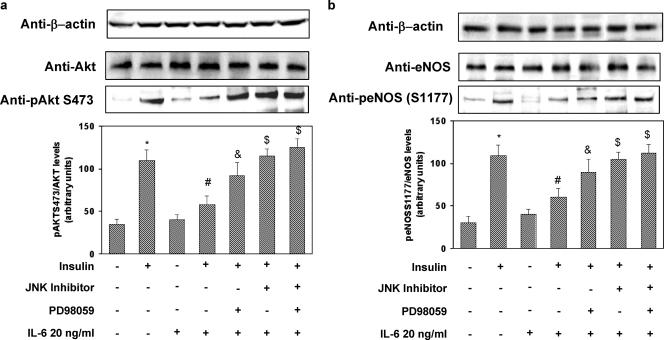
Next, we tested whether IL-6 would also affect insulin-stimulated Akt/eNOS pathway activation in vivo. Preliminary time-course experiments with C57BL/6J mice showed that the effects of IL-6 were maximal after 1 h of pretreatment (data not shown). In mice treated for 1 h with IL-6, phosphorylation of ERK1/2 and JNK in the aortas was increased 4.0- and 3.0-fold, respectively (levels in aortas of IL-6 treated, insulin-stimulated mice versus levels in aortas of non-IL-6-treated, insulin-stimulated mice; P < 0.01) (Fig. 9a and b). These stimulatory effects of IL-6 were paralleled by increased phosphorylation of IRS-1 at Ser612 (orthologous to Ser616 in human IRS-1) and Ser307(orthologous to Ser312 in human IRS-1), respectively (Fig. 9c and d). IL-6 effects were reversed by treatment with PD98059 and JNK inhibitor I, respectively (Fig. 9a, b, c, and d). By contrast, according to the results obtained with HUVECs, SOCS-3 expression was not induced by IL-6 during the time frame of its maximal effect on STAT-3 activation (data not shown). Insulin increased Akt phosphorylation on Ser473 2.2-fold and phosphorylation of eNOS on Ser1177 2.1-fold in the mouse aortas (levels in aortas of insulin-stimulated mice versus basal levels; P < 0.01) (Fig. 10a and b). IL-6 treatment resulted in 52 and 53% decreases of insulin-stimulated Akt and eNOS phosphorylation, respectively (P < 0.01). Treatment of mice with JNK inhibitor I or PD98059 reversed the inhibitory effect of IL-6 (Fig. 10a and b).
FIG. 9.
Reversibility of the effect of IL-6 on IRS-1, JNK, and ERK1/2 phosphorylation in C57BL/6J mouse aortas. Three-month-old C57BL/6J female mice were injected i.p. with rhIL-6 1 h before insulin stimulation. In experiments using JNK inhibitor I or PD98059, these were injected i.p. at 10 mg/kg of body weight 2 h before IL-6 injection. Animals were then stimulated with insulin (i.p., 0.75 mU/g of body weight). The aortas were immediately collected and snap-frozen in liquid nitrogen. Equal amounts of aortic lysates were subjected to Western blotting with the appropriate specific phosphoantibodies as described in Materials and Methods. To normalize the blots for protein levels, blots were stripped and reprobed with primary antibodies against the total unphosphorylated form of the indicated protein. (a) ERK1/2 phosphorylation (lower blot) and total levels of ERK1/2 (upper blot). (b) JNK phosphorylation (lower blot) and total levels of JNK (upper blot). (c) Ser612 phosphorylation of IRS-1(lower blot) and total levels of IRS-1 (upper blot). IP: immunoprecipitation. (d) Ser307 phosphorylation of IRS-1(lower blot) and total levels of IRS-1 (upper blot). Each bar represents the mean ± SD of five independent experiments; the blots shown are from representative experiments. WB: Western blot. *: levels in aortas of IL-6-treated mice versus levels in aortas of control mice; P < 0.01. #: levels in aortas of IL-6-treated mice after injection of either JNK inhibitor I or PD98059 or both versus levels in aortas of IL-6-treated mice; P < 0.01. +: present. −: absent.
FIG. 10.
Effects of IL-6 on insulin-stimulated phosphorylation of eNOS and AKT in aortas of C57BL/6J mice. Three-month-old C57BL/6J female mice were injected IP with rhIL-6 for the indicated times. For experiments using JNK inhibitor I or PD98059, these were injected IP at 10 mg/kg of body weight 2 h before IL-6 injection. Animals were then stimulated with insulin (IP, 0.75 mU/g of body weight). The aortas were immediately collected and snap-frozen in liquid nitrogen. Equal amounts of aortic lysates were subjected to Western blotting with the appropriate specific phosphoantibodies as described in Materials and Methods. To normalize the blots for protein levels, blots were stripped and reprobed with primary antibodies against the total unphosphorylated form of the indicated protein. In addition to being normalized for gel loading, the same blots were reprobed with a beta-actin antibody. (a) Ser473 Akt phosphorylation (lower blot), total levels of Akt (middle blot), and levels of beta-actin levels (upper blot). (b) Ser1177 eNOS phosphorylation (lower blot), total levels of eNOS (middle blot), and levels of beta-actin (upper blot). Each bar represents the mean ± SD of five independent experiments; the blots shown are from representative experiments. *: levels in aortas of insulin-stimulated mice versus levels in aortas of control mice; P < 0.01. #: levels in aortas of insulin-stimulated, IL-6 treated mice versus levels in aortas of insulin-stimulated mice; P < 0.01. $: P < 0.01. *: levels in aortas of insulin-stimulated, IL-6-treated mice after injection of either JNK inhibitor I or PD98059 or both versus levels in aortas of insulin-stimulated, IL-6-treated mice; P < 0.02. +: present. −: absent.
DISCUSSION
IL-6 plays a key role in driving the acute inflammatory response and orchestrates the production of acute-phase proteins. IL-6 circulating levels have been correlated with insulin resistance and markers of endothelial dysfunction (11, 21). The vasodilator action of insulin is mediated by the signaling pathway involving IR/IRS-1/PI3-kinase/Akt/eNOS that leads to increased NOS activity in the endothelium (23, 37). In this study, we inquired whether IL-6-induced alterations in insulin signaling contribute to impairing endothelial insulin action. We provide evidence that exposure of HUVECs to IL-6 resulted in inhibition of insulin-stimulated NOS activity and NO production. This event was associated with increased JNK1/2 and ERK1/2 activity that was paralleled by concomitant increases in IRS-1 phosphorylation at Ser312 and Ser616, respectively. We further demonstrated the cause-and-effect relationship between these two events by inhibiting JNK1/2 and ERK1/2 using two different experimental approaches (chemical inhibition of these two kinases or knockdown of their expression with specific siRNA sequences). Both approaches fully restored the stimulatory effects of insulin. Obviously, we cannot exclude the possibility that other serine kinases may phosphorylate IRS-1 upon IL-6 exposure, leading to impairment in vascular insulin action, although we failed to observe rescue of the negative effects of IL-6 on NOS activity stimulated by insulin when treating HUVECs with inhibitors of either the mammalian target of rapamycin or inhibitor κB kinase (data not shown). Previous studies failed to detect increased IRS-1 phosphorylation at serine residues in response to IL-6 (18, 29). Differences in the cell type (e.g., primary versus transformed cell lines), in IL-6 receptor content in the tissue examined (e.g., endothelium versus adipose, hepatic, or muscle tissue), or in the timing of exposure to IL-6 (e.g., acute versus chronic treatment) may account for this disparity. Notwithstanding, the present results suggest that IL-6-induced activation of JNK and ERK1/2 might be an important negative regulator for the insulin pathway in which eNOS activity is involved. Conflicting results for the effect of IL-6 on IR phosphorylation in response to insulin have also been reported. Thus, in vivo and in vitro studies have shown that chronic exposure to IL-6 resulted in an impaired ability of insulin to stimulate tyrosine phosphorylation of IR in mouse liver and 3T3-F4424 adipocytes (18, 29) but not in HepG2 human hepatocarcinoma cells or human subcutaneous fat cells and 3T3-L1 adipocytes (32, 33). In HepG2 cells, mouse liver, and 3T3-F4424 adipocytes, it has been shown that this reduced IR phosphorylation was due to an upregulation of SOCS-3 (32, 33). By contrast, we did not detect any increase in SOCS-3 expression in the time frame examined either in HUVECs or in aortas from C57BL/6J mice. These results may indicate either that the induction of SOCS-3 by IL-6 follows a different time course in HUVECs or that the major effect of IL-6 is exerted through other mechanisms, such as inhibition of the intrinsic IR tyrosine kinase by serine phosphorylated IRS-1, as suggested by the finding that inhibition of JNK1/2 and ERK1/2 activity reversed both the inhibitory effects of IL-6 on tyrosine phosphorylation of IR and IL-6-stimulated phosphorylation of IRS-1 at Ser312 and Ser616. In primary human endothelial cells, we have previously shown that impairment of the insulin signaling involving IRS-1/PI3-kinase/Akt provoked by either high glucose concentration or a naturally occurring genetic defect in IRS-1 resulted in reduced ability of insulin to phosphorylate eNOS on the positive regulatory site Ser1177 and to dephosphorylate the inhibitory site Thr495 (2, 10). Accordingly, we observed that the impaired activation of the insulin-dependent IRS-1/PI3-kinase/Akt pathway in HUVECs exposed to IL-6 was associated with a decrease in Ser1177 phosphorylation and an increased Thr495 phosphorylation, resulting in a reduction in NOS activity. It is thought that the phosphatase PP1 dephosphorylates Thr495, and inhibition of PP1 results in the hyperphosphorylation of Thr495, thus blunting eNOS activity. There is also evidence that insulin stimulates PP1 activity via a PI3-kinase-dependent pathway in rat cardiomyocytes (6). Interestingly, we observed that, in HUVECs, insulin stimulated PP1 activity, resulting in an increased dephosphorylation of Thr495. Both events were blocked by the PI3-kinase inhibitors wortmannin and LY-294002. In HUVECs exposed to IL-6, we observed impaired abilities of insulin to stimulate PP1 activity and to dephosphorylate Thr495, which were reversed by JNK and ERK1/2.
The results obtained in aortas isolated from C57BL/6J mice support the likelihood that our findings in cultured endothelial cells may have physiological meaning. These in vivo findings recapitulate our in vitro results showing that IL-6 impairs the ability of insulin to stimulate eNOS Ser1177 phosphorylation via mechanisms involving JNK and ERK1/2 activation. However, further studies are needed to clarify IL-6 action in vivo, since it is due to combined effects on multiple cell types.
Taken together, these data support the concept that IL-6 impairs the ability of insulin to stimulate NOS activity by regulating reciprocal phosphorylation of eNOS on Ser1177 and Thr495 via mechanisms involving activation of PI3-kinase/Akt and PI3-kinase/PP1, respectively. The inhibitory effects of IL-6 are likely to be mediated by the activation of JNK and ERK1/2 which induce phosphorylation of IRS-1 at Ser312 and Ser616, respectively, leading to dysfunction of IRS-1 as a docking protein (data not shown).
Acknowledgments
This study was supported by European Community FP6 EUGENE2 grant number LSHM-CT-2004-512013 to G. Sesti.
We thank Paola Iania for her skillful technical help.
Footnotes
Published ahead of print on 22 January 2007.
REFERENCES
- 1.Aguirre, V., T. Uchida, L. Yenush, R. Davis, and M. F. White. 2000. The c-Jun NH(2)-terminal kinase promotes insulin resistance during association with insulin receptor substrate-1 and phosphorylation of Ser(307). J. Biol. Chem. 275:9047-9054. [DOI] [PubMed] [Google Scholar]
- 2.Andreozzi, F., E. Laratta, A. Sciacqua, F. Perticone, and G. Sesti. 2004. Angiotensin II impairs the insulin signalling pathway promoting production of nitric oxide by inducing phosphorylation of IRS-1 on Ser312 and Ser616 in human umbilical vein endothelial cells. Circ. Res. 94:1211-1218. [DOI] [PubMed] [Google Scholar]
- 3.Balletshofer, B. M., K. Rittig, M. D Enderle, et al. 2000. Endothelial dysfunction is detectable in young normotensive first-degree relatives of subjects with type 2 diabetes in association with insulin resistance. Circulation 101:1780-1784. [DOI] [PubMed] [Google Scholar]
- 4.De Fea, K., and R. A. Roth. 1997. Modulation of insulin receptor substrate-1 tyrosine phosphorylation and function by mitogen-activated protein kinase. J. Biol. Chem. 272:31400-31406. [DOI] [PubMed] [Google Scholar]
- 5.De Fea, K., and R. A. Roth. 1997. Protein kinase C modulation of insulin receptor substrate-1 tyrosine phosphorylation requires serine 612. Biochemistry 36:12939-12947. [DOI] [PubMed] [Google Scholar]
- 6.De Luca, J. P., A. K. Garnache, J. Rulfs, and T. B. Miller, Jr. 1999. Wortmannin inhibits insulin-stimulated activation of protein phosphatase 1 in rat cardiomyocytes. Am. J. Physiol. 276:H1520-H1526. [DOI] [PubMed] [Google Scholar]
- 7.Dimmeler, S., I. Fleming, B. Fisslthaler, C. Hermann, R. Busse, and A. M. Zeiher. 1999. Activation of nitric oxide synthase in endothelial cells by Akt-dependent phosphorylation. Nature 399:601-605. [DOI] [PubMed] [Google Scholar]
- 8.Esposito, D. L., Y. Li, and A. Cama. 2001. Tyr(612) and Tyr(632) in human insulin receptor substrate-1 are important for full activation of insulin-stimulated phosphatidylinositol 3-kinase activity and translocation of GLUT4 in adipose cells. Endocrinology 142:2833-2840. [DOI] [PubMed] [Google Scholar]
- 9.Federici, M., M. L. Hribal, R. Menghini, H. Kanno, V. Marchetti, O. Porzio, S. W. Sunnarborg, S. Rizza, M. Serino, V. Cunsolo, D. Lauro, A. Mauriello, D. S. Smookler, P. Sbraccia, G. Sesti, D. C. Lee, R. Khokha, D. Accili, and R. Lauro. 2005. Timp3 deficiency in insulin receptor haploinsufficient mice promotes diabetes and vascular inflammation via increased TNF-α. J. Clin. Investig. 115:3494-3505. [DOI] [PMC free article] [PubMed] [Google Scholar]
- 10.Federici, M., A. Pandolfi, E. A. De Filippis, G. Pellegrini, R. Menghini, D. Lauro, M. Cardellini, M. Romano, G. Sesti, R. Lauro, and A. Consoli. 2004. G972R IRS-1 variant impairs insulin regulation of eNOS in cultured human endothelial cells. Circulation 109:300-405. [DOI] [PubMed] [Google Scholar]
- 11.Fernandez-Real, J. M., and J. Ricart. 2003. Insulin resistance and chronic cardiovascular inflammatory syndrome. Endocr. Rev. 24:278-301. [DOI] [PubMed] [Google Scholar]
- 12.Fleming, I., B. Fisslthaler, S. Dimmeler, B. E. Kemp, and R. Busse. 2001. Phosphorylation of Thr(495) regulates Ca(2+)/calmodulin-dependent endothelial nitric oxide synthase activity. Circ. Res. 88:E68-E75. [DOI] [PubMed] [Google Scholar]
- 13.Fleming, I., and R. Busse. 2003. Molecular mechanisms involved in the regulation of the endothelial nitric oxide synthase. Am. J. Physiol. Regul. Integr. Comp. Physiol. 284:R1-R12. [DOI] [PubMed] [Google Scholar]
- 14.Fulton, D., J. P. Gratton, T. J. McCabe, J. Fontana, Y. Fujio, K. Walsh, T. F. Franke, A. Papapetropoulos, and W. C. Sessa. 1999. Regulation of endothelium-derived nitric oxide production by the protein kinase Akt. Nature 399:597-601. [DOI] [PMC free article] [PubMed] [Google Scholar]
- 15.Ginsberg, H. N. 2000. Insulin resistance and cardiovascular disease. J. Clin. Investig. 106:453-458. [DOI] [PMC free article] [PubMed] [Google Scholar]
- 16.Hotamisligil, G. S., P. Peraldi, A. Budavari, R. Ellis, M. F. White, and B. M. Spiegelman. 1996. IRS-1-mediated inhibition of insulin receptor tyrosine kinase activity in TNF-alpha- and obesity-induced insulin resistance. Science 271:665-668. [DOI] [PubMed] [Google Scholar]
- 17.Hu, F. B., M. J. Stampfer, S. M. Haffner, C. G. Solomon, W. C. Willett, and J. E. Manson. 2002. Elevated risk of cardiovascular disease prior to clinical diagnosis of type 2 diabetes. Diabetes Care 25:1129-1134. [DOI] [PubMed] [Google Scholar]
- 18.Klover, P. J., T. A. Zimmers, L. G. Koniaris, and R. A. Mooney. 2003. Chronic exposure to interleukin-6 causes hepatic insulin resistance in mice. Diabetes 52:2784-2789. [DOI] [PubMed] [Google Scholar]
- 19.Lagathu, C., J.-P. Bastard, M. Auclair, M. Maachi, J. Capeau, and M. Caron. 2003. Chronic interleukin-6 (IL-6) treatment increased IL-6 secretion and induced insulin resistance in adipocyte: prevention by rosiglitazone. Biochem. Biophys. Res. Commun. 311:372-379. [DOI] [PubMed] [Google Scholar]
- 20.Lusis, A. J. 2000. Atherosclerosis. Nature 407:233-241. [DOI] [PMC free article] [PubMed] [Google Scholar]
- 21.Meigs, J. B., F. B. Hu, N. Rifai, and J. E. Manson. 2004. Biomarkers of endothelial dysfunction and risk of type 2 diabetes mellitus. JAMA 291:1978-1986. [DOI] [PubMed] [Google Scholar]
- 22.Moncada, S., and A. Higgs. 1993. The l-arginine-nitric oxide pathway. N. Engl. J. Med. 329:2002-2012. [DOI] [PubMed] [Google Scholar]
- 23.Montagnani, M., H. Chen, V. A. Barr, and M. J. Quon. 2001. Insulin-stimulated activation of eNOS is independent of Ca2+ but requires phosphorylation by Akt at Ser(1179). J. Biol. Chem. 276:392-398. [DOI] [PubMed] [Google Scholar]
- 24.Perticone, F., R. Ceravolo, A. Pujia, G. Ventura, S. Iacopino, A. Scozzafava, A. Ferraro, M. Chello, P. Mastroroberto, P. Verdecchia, and G. Schillaci. 2001. Prognostic significance of endothelium dysfunction in hypertensive patients. Circulation 104:191-196. [DOI] [PubMed] [Google Scholar]
- 25.Pickup, J. C. 2004. Inflammation and activated innate immunity in the pathogenesis of type 2 diabetes. Diabetes Care 27:813-823. [DOI] [PubMed] [Google Scholar]
- 26.Pradhan, A. D., J. E. Manson, N. Rifai, J. E. Buring, and P. M. Ridker. 2001. C-reactive protein, interleukin 6, and risk of developing type 2 diabetes mellitus. JAMA 286:327-334. [DOI] [PubMed] [Google Scholar]
- 27.Quyyumi, A. A. 1998. Endothelial function in health and disease: new insights into the genesis of cardiovascular disease. Am. J. Med. 105:32S-39S. [DOI] [PubMed] [Google Scholar]
- 28.Ross, R. 1999. Atherosclerosis: an inflammatory disease? N. Engl. J. Med. 340:115-126. [DOI] [PubMed] [Google Scholar]
- 29.Rotter, V., I. Nagaev, and U. Smith. 2003. Interleukin-6 (IL-6) induces insulin resistance in 3T3-L1 adipocytes and is, like IL-8 and tumor necrosis factor-α, overexpressed in human fat cells from insulin-resistant subjects. J. Biol. Chem. 278:45777-45784. [DOI] [PubMed] [Google Scholar]
- 30.Saltiel, A. R., and C. R. Kahn. 2001. Insulin signalling and the regulation of glucose and lipid metabolism. Nature 414:799-806. [DOI] [PubMed] [Google Scholar]
- 31.Schmidt, M. I., B. B. Duncan, A. R. Sharrett, G. Lindberg, P. J. Savage, S. Offenbacher, M. I. Azambuja, R. P. Tracey, and G. Heiss. 1999. Markers of inflammation and prediction of diabetes mellitus in adults (Atherosclerosis Risk in Communities study): a cohort study. Lancet 353:1649-1652. [DOI] [PubMed] [Google Scholar]
- 32.Senn, J. J., P. J. Klover, I. A. Nowak, and R. A. Mooney. 2002. Interleukin-6 induces cellular insulin resistance in hepatocytes. Diabetes 51:3391-3399. [DOI] [PubMed] [Google Scholar]
- 33.Senn, J. J., P. J. Klover, I. A. Nowak, T. A. Zimmers, L. G. Koniaris, R. W. Furlanetto, and R. A. Mooney. 2003. Suppressor of cytokine signaling-3 (SOCS-3), a potential mediator of interleukin-6-dependent insulin resistance in hepatocytes. J. Biol. Chem. 278:13740-13746. [DOI] [PubMed] [Google Scholar]
- 34.Steinberg, H. O., H. Chaker, R. Leaming, A. Johnson, G. Brechtel, and A. D. Baron. 1996. Obesity/insulin resistance is associated with endothelial dysfunction. Implications for the syndrome of insulin resistance. J. Clin. Investig. 97:2601-2610. [DOI] [PMC free article] [PubMed] [Google Scholar]
- 35.Steinberg, H. O., G. Brechtel, A. Johnson, N. Fineberg, and A. D. Baron. 1994. Insulin-mediated skeletal muscle vasodilation is nitric oxide dependent: a novel action of insulin to increase nitric oxide release. J. Clin. Investig. 94:1172-1179. [DOI] [PMC free article] [PubMed] [Google Scholar]
- 36.Stern, M. P. 1995. Diabetes and cardiovascular disease. The “common soil” hypothesis. Diabetes 44:369-374. [DOI] [PubMed] [Google Scholar]
- 37.Vicent, D., J. Ilany, T. Kondo, K. Naruse, S. J. Fisher, Y. Y. Kisanuki, S. Bursell, M. Yanagisawa, G. L. King, and C. R. Kahn. 2004. The role of endothelial insulin signaling in the regulation of vascular tone and insulin resistance. J. Clin. Investig. 111:1373-1380. [DOI] [PMC free article] [PubMed] [Google Scholar]
- 38.Zeng, G., F. H. Nystrom, L. V. Ravichandran, L. N. Cong, M. Kirby, H. Mostowski, and M. J. Quon. 2000. Roles for insulin receptor, PI3-kinase, and Akt in insulin signaling pathways related to production of nitric oxide in human vascular endothelial cells. Circulation 101:1539-1545. [DOI] [PubMed] [Google Scholar]


