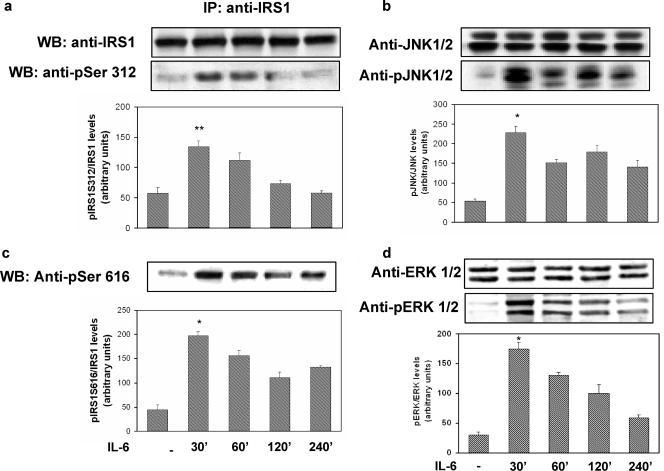
FIG. 1.
Time course of the effects of IL-6 on IRS-1, JNK, and ERK1/2 phosphorylation in HUVECs. The HUVECs were incubated with 20 ng/ml of IL-6 for the times indicated at the bottom, and cell lysates were subjected to Western blot analysis as indicated in Materials and Methods. (a) Ser312 phosphorylation of IRS-1 (lower blot) and total levels of IRS-1 (upper blot). (b) JNK phosphorylation (lower blot) and total levels of JNK (upper blot). IP, immunoprecipitation. (c) Ser616 phosphorylation of IRS-1. (d) ERK1/2 phosphorylation (lower blot) and total levels of ERK1/2 (upper blot). Each bar represents the mean ± SD of three independent experiments; the blots shown are from representative experiments. WB, Western blot. **: P < 0.01. *: levels in IL-6-treated cells versus levels in non-IL-6-treated cells; P < 0.02.

